5-6
AVIATION WEATHER REPORTS, FORECASTS, AND WEATHER CHARTS
A few reports and forecasts that are available to pilots were
discussed briefly in previous portions of this chapter. This section will
discuss these reports and forecasts in greater detail along with weather
charts. Although pilots may often receive a telephone briefing, they should
be able to read and interpret these reports, forecasts, and charts. Printed
aviation data may be found at the National Weather Service Office, flight
service stations, as well as reports generated through a direct user access
terminal (DUAT) system.
Although this section contains a great deal of information about
reports, forecasts, and charts, for further information, reference should
be made to AC 00-45 (latest revision), Aviation Weather Services, which
is for sale by the Superintendent of Documents, U.S. Government Printing
Office, Washington, DC 20402.
Aviation Weather Reports
These reports provide information on existing conditions
at the time the report was generated. The aviation routine weather report
(METAR) provides surface weather conditions at a specified location and
is presented in a coded format which is standard internationally. A pilot
weather report (PIREP) is generated from information received from a pilot
in flight. A RADAR weather report contains information on thunderstorms
and precipitation as observed by radar. Aviation Routine Weather Report
(METAR)
The aviation routine weather report contains various weather
elements in a coded form. The elements of the report are: [Figure 5-30]
• Type of Report
• Station Designator
• Time of Report
• Wind
• Visibility
• Weather and Obstructions to Visibility
• Sky Conditions
• Temperature and Dewpoint
• Altimeter Setting
• Remarks |
|
|
Figure 5-30.—Key to aviation routine weather report observations.
|
Example:
METAR KBNA 1250Z 33018KT 290V360 1/2SM
R31/2700FT +SN BLSN FG VV008 00/M03 A2991 RMK RAE42SNB42
Explanation:
• This is an aviation routine weather report.
• It is for Nashville, Tennessee.
• The observation was taken at 1250 universal coordinated time
(UTC).
• The wind is from 330° at 18 knots, with the direction varying
from 290 to 360°.
KEY TO METAR (NEW AVIATION ROUTINE WEATHER REPORT) OBSERVATIONS
TYPE OF REPORT:
There are two types of report—the METAR which is a routine observation
report and SPECI which is a Special METAR weather observation. The type
of report, METAR or SPECI, will always appear in the report header or lead
element of the report.
STATION DESIGNATOR:
The METAR code uses ICAO 4-letter station identifiers. In the
contiguous 48 states, the 3-letter domestic station identifier is prefixed
with a "K." Elsewhere, the first two letters of the ICAO identifier indicate
what region of the world and country (or state) the station is in. For
Alaska, all station identifiers start with "PA;" for Hawaii, all station
identifiers start with "PH."
TIME:
The time the observation is taken is transmitted as a four-digit
time group appended with a Z to denote Coordinated Universal Time (UTC).
WIND:
The wind is reported as a five-digit group (six digits if speed
is over 99 knots). The first three digits is the direction the wind is
blowing from in ten's of degrees, or "VRB" if the direction is variable.
The next two digits is the speed in knots, or if over 99 knots, the next
three digits. If the wind is gusty, it is reported as a "G" after the speed
followed by the highest gust reported.
VISIBILITY:
Visibility is reported in statute miles with "SM" appended to
it. Runway Visual Range (RVR), when reported, is in the format: R(runway)/(visual
range)FT. The"R" identifies the group followed by the runway heading, a
"/" and the visual range in feet (meters in other countries).
WEATHER:
The weather as reported in the METAR code represents a significant
change in the way weather is currently reported. In METAR, weather is reported
in the format: Intensity, Proximity, Descriptor, Precipitation, Obstructions
to visibility, or Other.
Intensity—applies only to the first type of precipitation reported.
A "-" denotes light, no symbol denotes moderate, and a "+" denotes heavy.
Proximity—applies to and reported only for weather occurring in
the vicinity of the airport (between 5 and 10 miles of the center of the
airport runway complex). It is denoted by the letters "VC."
Descriptor—these seven descriptors apply to the following precipitation
or obstructions to visibility:
TS - thunderstorm
SH - shower(s)
FZ - freezing
BC - patches
BL - blowing
DR - low drifting
MI - shallow
Precipitation—there are eight types of precipitation in the METAR
code:
RA - rain
DZ - drizzle
SN - snow
SG - snow grains
GR - hail (>1/4 in.)
GS - small hail/snow pellets
PE - ice pellets
IC - ice crystals
Obstructions to visibility—there are eight types of obstructing
phenomena in the METAR code:
BR - mist (vsby 5/8-6 mi)
SA - sand
FU - smoke
DU - dust
HZ - haze
VA - volcanic ash
FG - fog
PY - spray
Note: Fog (FG) is reported only when the visibility is less than
five eighths of a mile otherwise mist (BR) is reported.
Other—there are five categories of other weather phenomena which
are reported when they occur:
SQ-squall
DS-duststorm
FC-funnel cloud/ tornado/ waterspout
SS-sandstorm
PO-dust/sand woos
SKY CONDITION:
The sky condition as reported in METAR represents a significant
change from the way sky condition is currently reported. In METAR, sky
condition is reported in the format:
Amount, Height, (Type), or Vertical Visibility
Amount—the amount of sky cover is reported in eighths of sky
cover, using the contractions:
SKC-clear (no clouds)
SCT-scattered (1/8 to 4/8's of clouds)
BKN-broken (5/8's to 7/8's of clouds)
OVC-overcast (8/8's of clouds)
Note: A ceiling layer is not designated in the METAR code. For
aviation purposes, the ceiling is the lowest broken or overcast layer,
or vertical visibility into an obscuration. Also, there is no provision
for reporting thin layers in the METAR code.
Height—cloud bases are reported with three digit; in hundreds
of feet.
(Type)—if towering cumulus clouds (TCU) or cumulonimbus clouds
(CB) are present, they are reported after the height which represents their
base.
Vertical Visibility—total obscurations are reported in the format
"VVhhh" where VV denotes vertical visibility and "hhh" is the vertical
visibility in hundreds of feet. There is no provision in the METAR code
to report partial obscurations
TEMPERATURE/DEWPOINT-
Temperature and dewpoint are reported in a two-digit form in degrees
Celsius. Temperatures below zero are prefixed with an "M."
ALTIMETER:
Altimeter settings are reported in a four-digit format in inches
of mercury prefixed with an "A" to denote the units of pressure.
REMARKS:
Remarks are limited to reporting significant weather, the beginning
and ending times of certain weather phenomena, and low-level wind shear
of significance to aircraft landing and taking off. The contraction "RMK"
precedes remarks. Wind shear information is denoted by "WS" followed by
"TKO" for takeoff or "LDG" for landing, and the runway "RW" affected.
 |
 |
|
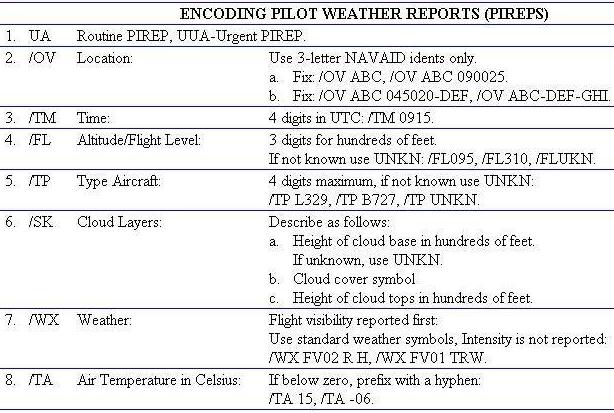
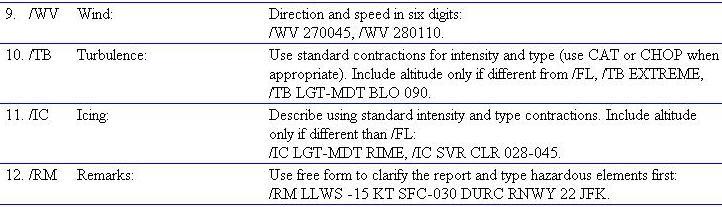
Figure 5-31.—Encoding pilot weather reports.
|
• The visibility is one-half statute mile.
• The runway visual range for runway 31 is 2,700 feet and the visibility
is obstructed by heavy blowing snow and fog.
• The sky is obscure with a vertical visibility of 800 feet.
• The temperature is 0° C and the dewpoint is -3° C.
• The altimeter setting is 29.91 inches.
• The rain ended at 42 past the hour and snow began at 42 past the
hour.
Pilot Weather Reports (PIREPs)
The pilot weather reports are a timely and helpful observation
to fill in the gap between reporting stations. Aircraft in flight are the
only means of directly observing cloud tops, icing, and turbulence.
A pilot weather report is usually transmitted as an individual
report, but can be appended to a surface report. Figure 5-31 shows the
format, and how to decode the information contained in a PIREP. Most of
the contractions in a PIREP are self-explanatory to use standard terminology.
Example:
UA /OV OKC 063064/TM 1522/FL080/TP C172/
TA -04/WV 245040/TB LGT/RM IN CLR
Explanation:
• This is a routine pilot weather report.
• The location is 64 nautical miles (NM) on the 63° radial from
Oklahoma City VOR.
• The time of the report is 1522 UTC.
• The aircraft altitude is 8,000 feet.
• The type of aircraft is a Cessna 172.
• The temperature is -4° C.
• The wind is from 245° at 40 knots. There is light turbulence.
• The aircraft is in clear skies.
Radar Weather Reports (RAREPs)
The radar weather reports provide information on thunderstorms
and areas of precipitation as observed by radar. These reports include
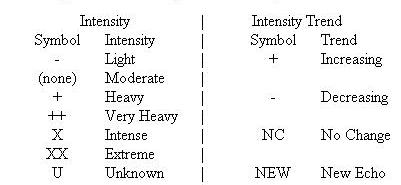
the type, intensity, intensity trend, and location of precipitation. Also
included is the echo top of the precipitation, and if significant, the
base echo. All heights are reported in above mean sea level (MSL).
The contents of a radar weather report include:
• Location identifier and time of radar observation.
• Echo patterns which can be identified as:
• Line (LN)—a line of precipitation echoes at least 30 miles long,
is at least five times as long as it is wide, and is at least 30 percent
coverage within the line.
• Fine Line (FINE LN)—a unique, clear air echo (usually precipitation
and cloud free) in the form of a thin or fine line in the planned position
indicator (PPI) scope. It represents a strong temperature/moisture boundary
such as an advancing cold front.
• Area (AREA)—a group of echoes of similar type and not classified
as a line.
• Spiral Band Area (SPRL BAND AREA)—an area of precipitation associated
with a hurricane that takes on a spiral band configuration around the center.
• Single Cell (CELL)—a single, isolated convective echo such as a rain
shower.
• Layer (LYR)—an elevated layer of stratiform precipitation not reaching
the ground.
• Coverage in tenths.
• Type, intensity, and trend of weather. [Figure 5-32]
• Azimuth, referenced to true north, and range in nautical miles (NM),
of points defining the echo pattern.
• Dimension of the echo pattern. The dimension is given when the azimuth
and range define only the center line of the pattern.
• Pattern movement. The movement of individual storms or cells “C”
and area movement “A” may also be indicated.
• Maximum top land location.
• Remarks which are normally self-explanatory and use plain language
contractions.
• Digital section used for preparing a radar summary chart.
 |
|
|
Figure 5-32.—Precipitation intensity and trend.
|
|
Example:
FAR 1133 AREA 4TRW+/+ 22/100 88/170 196/180 220/115 C2425 MT 310 AT
162/110
Explanation:
Fargo, ND radar weather observation at 1133 UTC. An area of echoes,
four-tenths coverage, containing thunderstorms and heavy rain showers,
increasing in intensity. Area is defined by points at 22°, 100 NM;
88°, 170 NM; 196°, 180 NM and 220°, 115 NM. These points, plotted
on a map with straight lines, outline the area of echoes. The thunderstorm
cells are moving from 240° at 25 knots. Maximum top (MT) is 31,000
feet MSL located at 162° and 110 NM from Fargo.
Aviation Forecasts
Forecasts especially prepared for aviation include terminal aerodrome
forecast (TAF), area forecasts (FA), winds and temperatures aloft forecasts
(FD), AIRMET (WA), SIGMET (WS), and CONVECTIVE SIGMET (WST). These forecasts
help a pilot in flight planning and alert the pilot to any significant
weather which is forecast for the intended flight.
Terminal Aerodrome Forecasts (TAF)
The terminal aerodrome forecasts are prepared to give a description
of expected conditions at an airport and within a 5 nautical mile radius
of a runway complex. A terminal aerodrome forecast is a concise statement
of the expected meteorological conditions over a specified time period,
usually 24 hours. Figure 5-33 provides information on the format and information
contained in the TAF. The descriptors and abbreviations used in the TAF
are the same as those used in the METAR report. [Figure 5-30]
Explanation of figure 5-34:
1. The terminal aerodrome forecast was issued for Memphis, TN
on the 12th of the month at 1720 UTC and is valid from 1800 UTC to 1800
UTC (24 hours).
2. The forecast from 1800Z to 2200Z is wind from 200° at
12 knots, visibility 5 statute miles in haze, broken clouds at 3,000 feet.
A 40-49 percent chance of thunderstorms with moderate rain, visibility
1 statute mile, and overcast sky at 800 feet by cumulonimbus cloud.
3. Forecast from 2200Z to 0200Z, wind from 330° at 15 knots
with gusts to 20 knots, visibility greater than 6 statute miles, broken
clouds at 1,500 feet, overcast clouds at 2,500 feet. Between the hours
of 2200Z and 0200Z, there is a 40-49 percent chance of visibility 3 statute
miles in moderate rain showers.
{Beginning of page 5-30}
Figure 5-33.—Terminal aerodrome forecast (TAF) format.
TYPE Routine (TAF) Amended (TAF AMD)
LOCATION ICAO four-letter location identifier (contiguous) 48
states, the 3-letter
domestic identifier prefixed with a "K;" elsewhere the first
two letters of
the ICAO identifier indicate what region of world and country
(or state)
the station is in.
ISSUANCE DATE/TIME A six-digit group giving the date (first two
digits) the time (last four
digits) in UTC.
VALID PERIOD A four-digit group which gives the valid period,
usually 24 hours, of the
forecast in UTC. Where airports or terminals operate part time,
the TAF
will have the abbreviated statement "AMD NOT SKED AFT (closing
time) UTC" added to their forecast. For a TAF issued after these
locations are closed, the word "NIL" will appear in place of
forecast text.
FORECAST Body of the TAF has a basic format:
WIND/VISIBILITY/WEATHER/SKY CONDITION
WIND Five or six digits followed by "KT" wind speed in knots.
The first three
are direction and last two speed unless 100 knots or greater
than three
digits. Wind gust denoted by the letter "G" appended to the
wind speed
followed highest gust. Variable wind direction noted by "VRB"
where
direction usually appears. A calm wind (3 knots less) is shown
as
00000KT.
VISIBILITY
Prevailing visibility up to and including 6 statute miles (SM follows
miles) including fractions of miles. Visibility greater
than 6 miles is
forecast as P6SM.
WEATHER
Weather phenomena significant to aviation are included and follow a
format which is: Intensity or
Proximity/Descriptor/Precipitation/Obstruction/Visibility/Other.
SKY CONDITION
Sky condition is presented in a format which includes Amount/Height
(Type) or Vertical Visibility.
OTHER Probability -
A PROB40 HHhh group in a TAF indicates the probability
of occurrence of thunderstorms or other precipitation. PROB40
indicates
a 40-49% chance and PROB30 indicates a 30-39% chance. The HHhh
is
a four-digit beginning and ending time.
TEMPORARY CONDITIONS
Changes usually lasting less than an hour. TEMPO HHhh (beginning and
ending time).
FORECAST CHANGE GROUPS
Used when a significant or permanent change is expected. The change
is
indicated by the group FMHH (from) and BECMG (becoming) followed
by HHhh (times).
4. From 0200Z to 0600Z, wind from 350° at 12 knots, overcast
clouds at 800 feet. Between 0200Z and 0500Z, a 40-49 percent chance of
visibility 2 statute miles in light rain and snow mixed. (Since the visibility
is not included, it is not expected to change from the 6 statute miles.)
5. Between 0600Z and 0800Z, conditions forecast to become wind
from 020° at 8 knots, no significant weather, broken clouds at 1,200
feet with conditions continuing until 1000Z.
6. Between 1000Z and 1200Z, conditions forecast to be wind calm,
visibility 3 statute miles in mist with clear skies. Between 1200 and 1400Z,
visibility temporarily 1/2 statute mile in fog. Conditions continuing until
1600Z.
7. From 1600Z until the end of the forecast, wind variable in
direction at 4 knots, visibility greater than 6 statute miles, no significant
weather, and sky clear.
Area Forecast (FA)
An area forecast contains general weather conditions over an area
the size of several states. It is used to determine forecast en route weather
and to help in determining weather at airports for which TAF’s are not
issued. Area forecasts are issued three times a day by the National Aviation
Weather Advisory Unit in Kansas City, MO for each of the six areas in the
contiguous 48 states. Alaska uses a different format for their respective
reports which are issued for the areas of Anchorage, Fairbanks, and Juneau.
There is also a specialized FA for the Gulf of Mexico which combines both
aviation and marine information, and is intended to support offshore helicopter
operations. The format of an FA is:
• Communication and product headers.
• Precautionary statements.
• Synopsis (brief summary of location and movement of fronts,
pressure systems, and circulation patterns for an 18-hour period).
• VFR clouds and weather (contains a 12-hour specific forecast
followed by a 6-hour, 18-hour in Alaska, categorical outlook giving a total
forecast period of 18-hours, 30 in Alaska).
Example:
SLCC FA 141045
SYNOPSIS AND VFR CLDS/WX
SYNOPSIS VALID UNTIL 150500
CLDS/WX VALID UNTIL 142300...OTLK VALID 142300-150500
ID MT NV UT WY CO AZ NM
SEE AIRMET SIERRA FOR IFR CONDS AND MTN OBSCN. TSTMS IMPLY PSBL SVR
OR GTR TURBC SVR ICG LLWS AND IFR CONDS.
NON MSL HEIGHTS HGTS ARE DENOTED BY AGL OR CIG.
SYNOPSIS...HIGH PRES OR NERN MT CONTG EWD GRDLY. LOW PRES OVR AZ NM
AND WRN TX RMNG GENLY STNRY. ALF...TROF EXTDS FROM WRN MT INTO SRN AZ RMNG
STNRY.
{Beginning of page 5-31}
Figure 5-34.—Example of terminal aerodrome forecast (TAF).
KMEM 121720Z 1818 20012KT 5SM HZ BKN030 PROB40 2022 1SM TRSA
OVC008CB1 2
FM 22 33015G20KT P6SM BKN015 OVC025 PROB40 2202 3SM SHRA 3
FM02 35012 KT OVC008 PROB440 0205 2SM -RASN BECMG 0608 02008KT
P6SM NSW SKC 4 5
BECMG 1012 00000KT 3SM BR SKC TEMPO 1214 1/2SM FG FM16 VRB04KT
P6SM NSW SKC 6 7
ID MT
FROM YXH TO SHR TO 30SE BZN TO 60SE PIH TO LKT TO YXC TO YXH.
70-90 SCT-BKN 120-150. WDLY SCT RW-. TOPS SHWRS 180.OTKL...VFR.
RMNDR AREA...100-120. ISOLD RW-MNLY ERN PTNS AREA. OTKL...VFR.
UT NV NM AZ
80 SCT-BKN 150-200. WDLY SCT RW-/TRW-. CB TOPS 450.
OTKL...VFR.
WY CO
FROM BZN TO GCC TO LBL TO DVC TO RKS TO BZN. 70-90 BKN-OVC 200. OCLN
VSBY 3R-F. AFT 20Z WDLY SCT TRW-. CB TOPS 450. OTKL...MVFR CIG RW.
In-Flight Weather Advisories
In-flight weather advisories are unscheduled forecasts to advise
aircraft in flight of the development of potentially hazardous weather.
There are three types of in-flight weather advisories: SIGMET, AIRMET,
and convective SIGMET.
The format of these advisories consists of a heading and text.
The heading identifies the issuing Weather Service Forecast Office (WSFO),
type of advisory, and the valid period. The text of the advisory contains
a message identifier, a flight precautions statement, and further details
if necessary. Figure 5-35 shows an example of these advisories.
Significant Meteorological Information (SIGMET)
A SIGMET is issued to advise pilots of weather considered potentially
hazardous to ALL categories of aircraft, and is valid for the period stated
in the advisory. SIGMETs are based specifically on forecasts of:
• Severe icing not associated with thunderstorms.
• Severe or extreme turbulence or clear air turbulence (CAT) not associated
with thunderstorms.
• Dust storms, sandstorms, or volcanic ash lowering surface visibility
to below 3 miles.
• Volcanic eruption.
Figure 5-35.—Example of in-flight weather advisories.
ZCZC MKCWA4T ALL 242000
WAUS1 KDFW 241650
DFWT WA 241650 AMD
AIRMET TANGO UPDT 3 FOR TURBC...STG SFC WINDS AND
LLWS VALID UNTIL 242000
AIRMET TURBC...OK TX...UPDT
FROM OSW TO LRD TO PEQ TO 40W LBL TO OSW
OCNL MDT TURBC BLO 60 DUE TO STG AND GUSTY LOW
LVL WINDS. CONDS CONTG BYD 2000Z.
AIRMET STG SFC WINDS...TX
FROM CDS TO DFW TO SAT TO MAF TO CDS
AFT 18Z...SUSTAINED SFC WINDS GTR THAN 30 KTS XPCD.
COND CONTG BYD 2000Z.
LLWS BLO 20 AGL DUE TO STG WINDS DMSHG BY 18Z.
OTLK VALID 2000-0200Z...OK TX AR
MDT TURBC BLO 60 CONTG OVR OK/TX AND SPRDG INTO
AR BY 2200-0200Z. CONTG ENTR AREA BYD 0200Z.
MKCC WST 22185
CONVECTIVE SIGMET 20C
VALID UNTIL 2055Z
ND SD
FROM 90W MOT-GFK-ABR-90 MOT
INTSFYG AREA SVR TSTMS MOVG FROM 2445. TOP ABV
450. WIND GUSTS TO 60 KTS RPRTD. TORNADOES...HAIL TO
2 IN...WIND GUSTS TO 65 KTS PSBL ND PTN.
DFWP UWS 051710
SIGMET PAPA 1 VALID UNTIL 052110
AR LA MS
FROM STL TO 30N MEI TO BTR TO MLU TO STL
OCNL SVR ICING 90 TO 130 EXPCD.
FRZLVL 80 E TO 120 W. CONDS CONTG BYD 2100Z.
SFOR WS 100130
SIGMET ROMEO 2 VALID UNTIL 100530
OR WA
FROM SEA TO PDT TO EUG TO SEA
OCNL MOGR CAT BTN 280 AND 350 EXPCD DUE TO JTSTR.
CONDS BGNG AFT 0200Z CONTG BYD 0530Z AND SPRDG
OVR CNTRL ID BY 0400Z.
Airmen’s Meteorological Information (AIRMET)
An AIRMET is issued to advise pilots of significant weather, but
describes conditions at intensities lower than those which trigger SIGMETs.
AIRMETs are issued on forecast conditions such as:
• Moderate icing.
• Moderate turbulence.
• Sustained surface winds of 30 knots or more.
• Ceiling less than 1,000 feet and/or visibility less than 3 miles
affecting over 50 percent of the area at one time.
• Extensive mountain obscurement.
Convective Significant Meteorological Information
A convective SIGMET implies severe or greater turbulence, severe
icing, and low-level wind shear. A convective SIGMET may be issued for
any situation which the forecaster feels is hazardous to all categories
of aircraft. Convective SIGMETs are specifically based on:
• Severe turbulence due to:
• surface winds greater than or equal to 50 knots.
• hail at the surface greater than or equal to three-fourths inches
in diameter.
• tornadoes.
• Embedded thunderstorms.
• A line of thunderstorms.
• Thunderstorms greater than or equal to video integrator processor
(VIP) level 4 affecting 40 percent or more of an area at least 3,000 square
miles.
Winds and Temperatures Aloft Forecast (FD)
The winds and temperatures aloft forecast is for specific locations
in the contiguous United States. These forecasts are also prepared for
a network of locations in Alaska and Hawaii. Forecasts are made twice daily
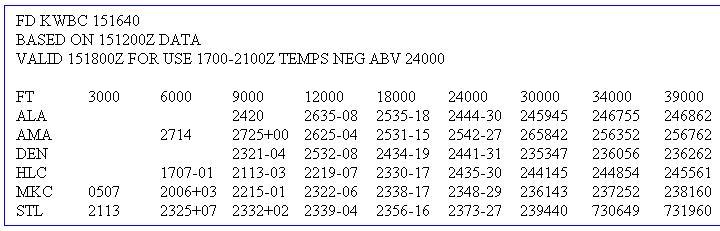
based on 00Z and 12Z data for use during specified time intervals. Figure
5-36 is an example of a winds and temperature aloft forecast.
In figure 5-36, the first line of the heading “FD KWBC 151640,”
the FD identifies this forecast as a winds and temperatures aloft forecast.
“KWBC” indicates that the forecast is prepared at the National Meteorological
Center. The other information indicates the data the forecast was based
on, and the valid time for the forecast. The forecast levels line labeled
“FT” shows the 9 standard levels in feet for which the winds and temperatures
apply. The levels through 12,000 feet are based on true altitude, and the
levels at 18,000 feet and above are based on pressure altitude. The station
identifiers denoting the location for which the forecast applies are arranged
in alphabetical order in a column along the left side of the data sheet.
The coded wind and temperature information in digits is found in columns
under each level and in the line to the right of the station identifier.
Note that at some of the lower levels the wind and temperature
information is omitted. The reason for the omission is that winds aloft
are not forecast for levels within 1,500 feet of the station elevation.
Also, note that no temperatures are forecast for the 3,000-foot level or
for a level within 2,500 feet of the station elevation.
Decoding: A 4-digit group shows the wind direction in reference
to true north, and the windspeed in knots. Refer to the St. Louis’ (STL)
forecast for the 3,000-foot level. The group “2113” means the wind is forecast
to be from 210° true north at a speed of 13 knots. To decode, a zero
is added to the end of the first two digits giving the direction in increments
of 10°, and the second two digits give speed in knots.
A 6-digit group includes the forecast temperature aloft. Refer
to the Denver (DEN) forecast for the 9,000-foot level. The group 2321-04
means the wind is forecast to be from 230° at 21 knots with a temperature
of -04° C.
If the windspeed is forecast to be 100 to 199 knots, the forecaster
adds 50 to the direction and subtracts 100 from the speed. To decode, the
reverse must be done; i.e., subtract 50 from the direction and add 100
to the speed. For example, if the forecast for the 39,000-foot level appears
as “731960,” subtract 50 from 73, and add 100 to 19, and the wind would
be 230° at 119 knots with a temperature of -60° C.
It is quite simple to recognize when the coded direction has been
increased by 50. Coded direction (in tens of degrees) ranges from 01 (010°)
to 36 (360°). Thus any coded direction with a numerical value greater
than “36” indicates a wind of 100 knots or greater. The coded direction
for winds of 100 to 199 knots ranges from 51 through 86.
If the windspeed is forecast to be 200 knots or greater, the wind
group is coded as 199 knots, i.e., “7799” is decoded 270 degrees at 199
knots or GREATER.
When the forecast speed is less than 5 knots, the coded group
is “9900” which means “LIGHT AND VARIABLE.”
Weather Charts
There are various graphic charts which depict weather conditions
at a specified time. These charts allow a pilot to get a picture of weather
conditions and an idea on the movement of weather systems and fronts.
 |
|
Figure 5-36.—Winds and temperature aloft forecast.
|
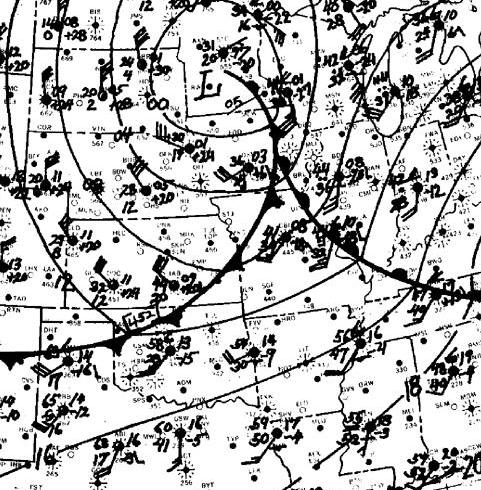
Surface Analysis Chart
The surface analysis chart, often referred to as a surface
weather map, is the basic weather chart. The chart is transmitted every
3 hours. The valid time of the map corresponds to the time of the plotted
observations. A date and time group in universal coordinated time (UTC)
informs the user of when the conditions portrayed on the map were actually
occurring. The surface analysis chart displays weather information such
as surface wind direction and speed, temperature, dewpoint, and various
other weather data. It also includes the position of fronts, and areas
of high or low pressure. [Figure 5-37]
Each reporting station is depicted on the chart by a small circle.
The weather information pertaining to the station is placed in a standard
pattern around this circle, and is called a station model. |
|
|
Figure 5-37.—Surface analysis chart.
|
 |
|
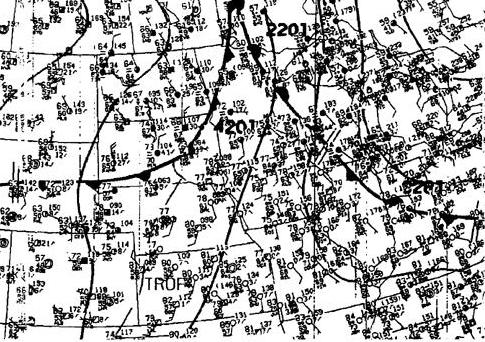
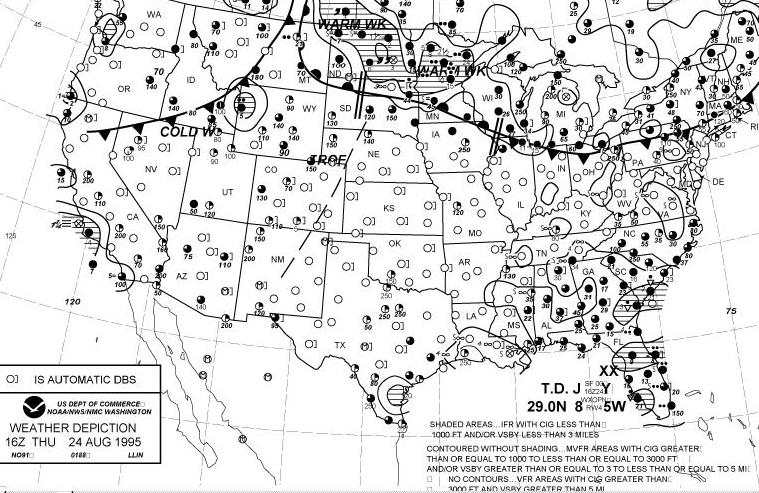
Figure 5-38.—Weather depiction chart.
|
Weather Depiction Chart
The weather depiction chart is prepared from surface aviation
observations and gives a quick picture of the weather conditions as of
the valid time stated on the chart. This chart is abbreviated to a certain
extent and contains only a portion of the surface weather information.
However, areas where clouds and weather may be a factor can be seen at
a glance. The chart also shows major fronts and high and low pressure centers,
and is considered to be a good place to begin a weather briefing for flight
planning. [Figure 5-38]
An abbreviated station model is used to plot data consisting of
total sky cover, cloud height or ceiling, weather and obstructions to vision,
visibility, and an analysis.
Cloud height is the lowest ceiling shown in hundreds of feet;
or if there is no ceiling, it is the height of the lowest layer. Weather
and obstructions to vision are shown using the same symbol designators
as the surface analysis. When visibility is less than 7 miles, it is entered
in miles and fractions of miles.
The chart shows ceilings and visibilities at reporting stations
and categorizes areas as IFR (outlined with smooth lines), MVFR (outlined
with scalloped lines), and VFR (not outlined).
For information which will assist in interpreting information
on both the surface analysis and weather depiction chart, refer to figures
5-39, 5-40, 5-41, 5-42, 5-43.
Radar Summary Chart
The radar summary chart aids in preflight planning by identifying
general areas and movement of precipitation and/or thunderstorms. Weather
radar generally detects precipitation only; it does not ordinarily detect
small water droplets such as found in fog and nonprecipitating clouds;
therefore, the absence of echoes does not guarantee clear weather.