Many accidents occur because pilots fail to understand the effect of varying conditions on airplane performance. In addition to the effects of weight and balance previously discussed, the following factors have a profound effect in changing airplane performance:
• Density Altitude
• Humidity
• Winds
• Runway Surface Conditions
• Runway Gradient
Density Altitude
Air density is perhaps the single most important factor affecting airplane performance. It has a direct bearing on the power output of the engine, efficiency of the propeller, and the lift generated by the wings.
As previously discussed in this handbook, when the air temperature increases, the density of the air decreases. Also, as altitude increases, the density of the air decreases. The density of the air can be described by referring to a corresponding altitude; therefore, the term used to describe air density is density altitude. To avoid confusion, remember that a decrease in air density means a high density altitude; and an increase in air density means a lower density altitude. Density altitude is determined by first finding pressure altitude, and then correcting this altitude for nonstandard temperature variations. It is important to remember that as air density decreases (higher density altitude), airplane performance decreases; and as air density increases (lower density altitude), airplane performance increases.
Effect of Density Altitude on Engine Power and Propeller Efficiency
An increase in air temperature or humidity, or decrease in air pressure resulting in a higher density altitude, significantly decreases power output and propeller efficiency.
The engine produces power in proportion to the weight or density of the air. Therefore, as air density decreases, the power output of the engine decreases. This is true of all engines that are not equipped with a supercharger or turbocharger. Also, the propeller produces thrust in proportion to the mass of air being accelerated through the rotating blades. If the air is less dense, propeller efficiency is decreased.
The problem of high-density altitude operation is compounded by the fact that when the air is less dense, more engine power and increased propeller efficiency are needed to overcome the decreased lift efficiency of the airplane wing. This additional power and propeller efficiency are not available under high-density altitude conditions; consequently, airplane performance decreases considerably.
Humidity
Because of evaporation, the atmosphere always contains some moisture in the form of water vapor. This water vapor replaces molecules of dry air and because water vapor weighs less than dry air, any given volume of moist air weighs less—is less dense—than an equal volume of dry air.
Usually during the operation of small airplanes, the effect of humidity is not considered when determining density altitude; but keep in mind that high humidity will decrease airplane performance which, among other things, results in longer takeoff distances and decreased angle of climb.
Effect of Wind on Airplane Performance
Wind has a direct effect on airplane performance. During takeoff, a headwind will increase the airplane performance by shortening the takeoff distance and increasing the angle of climb. However, a tailwind will decrease performance by increasing the takeoff distance and reducing the angle of climb. The decrease in airplane performance must be carefully considered by the pilot before a downwind takeoff is attempted.
During landing, a headwind will increase airplane performance by steepening the approach angle and reducing the landing distance. A tailwind will decrease performance by decreasing the approach angle and increasing the landing distance. Again, the pilot must take the wind into consideration prior to landing.
During cruise flight, winds aloft have somewhat an opposite effect on airplane performance. A headwind will decrease performance by reducing groundspeed, which in turn increases the fuel requirement for the flight. A tailwind will increase performance by increasing the groundspeed, which in turn reduces the fuel requirement for the flight.
Runway Surface Condition and Gradient
The takeoff distance is affected by the surface condition of the runway. If the runway is muddy, wet, soft, rough, or covered with tall grass, these conditions will act as a retarding force and increase the takeoff distance. Some of these surface conditions may decrease landing roll, but there are certain conditions such as ice or snow covering the surface that will affect braking action and increase the landing roll considerably.
The upslope or downslope of the runway (runway gradient) is quite
important when runway length and takeoff distance are critical. Upslope
provides a retarding force which impedes acceleration, resulting in a longer
ground run on takeoff.
Landing uphill usually results in a shorter landing roll. Downhill
operations will usually have the reverse effect of shortening the takeoff
distance and increasing the landing roll.
Ground Effect
When an airplane is flown at approximately one wing span or less above the surface, the vertical component of airflow is restricted and modified, and changes occur in the normal pattern of the airflow around the wing and from the wingtips. This change alters the direction of the relative wind in a manner that produces a smaller angle of attack. This means that a wing operating in ground effect with a given angle of attack will generate less induced drag than a wing out of ground effect. Therefore, it is more efficient. While this may be useful in specific situations, it can also trap the unwary into expecting greater climb performance than the airplane is capable of sustaining. In other words, an airplane can take off, and while in ground effect establish a climb angle and/or rate that cannot be maintained once the airplane reaches an altitude where ground effect can no longer influence performance. Conversely, on a landing, ground effect may produce “floating,” and result in overshooting, particularly at fast approach speeds.
Use of Performance Charts
Most airplane manufacturers provide adequate information from which the pilot can determine airplane performance. This information can be found in Airplane Flight Manuals or Pilot’s Operating Handbooks. Two commonly used methods of depicting performance data are tables and graphs.
Because all values are not listed on the tables or graphs, interpolation is often required to determine intermediate values for a particular flight condition or performance situation. Interpolation will be discussed later in this chapter.
The information on airplane performance charts is based on flight tests conducted under normal operating conditions, using average piloting skills, with the airplane and engine in good operating condition. Any deviation from the above conditions will affect airplane performance.
The performance data extracted from performance charts is accurate. To attain this accuracy, reasonable care must be exercised when computing performance information. It is important to consider that the performance of an older airplane will be less than that predicted by the performance charts.
Standard atmospheric conditions (temperature 59° F/15° C, zero relative humidity, and a pressure of 29.92 in. Hg. at sea level) are used in the development of performance charts. This provides a base from which to evaluate performance when actual atmospheric conditions change.
Interpolation
To interpolate means to compute intermediate values between a series of given values. In many instances when performance is critical, an accurate determination of the performance values is the only acceptable means to enhance safe flight. Guessing to determine these values should be avoided.
Interpolation is simple to perform if the method is understood. The following are examples of how to interpolate or accurately determine the intermediate values between a series of given values.
The numbers in column A range from 10 to 30 and the numbers in column B range from 50 to 100. Determine the intermediate numerical value in column B that would correspond with an intermediate value of 20 placed in column A.
A B
10 50
20 X = Unknown
30 100
It can be visualized that 20 is halfway between 10 and 30; therefore, the corresponding value of the unknown number in column B would be halfway between 50 and 100, or 75.
Many interpolation problems are more difficult to visualize than the preceding example; therefore, a systematic method must be used to determine the required intermediate value. The following describes one method that can be used.
The numbers in Column A range from 10 to 30 with intermediate
values of 15, 20, and 25. Determine the intermediate numerical value in
column B that would correspond with 15 in column A.
A B
10 50
15
20
25
30 100
First, in column A, determine the relationship of 15 to the range between 10 and 30 as follows:
15 - 10 5
------- = -- or 1/4
30 - 10 20
It should be noted that 15 is 1/4 of the range between 10 and 30. Now determine 1/4 of the range of column B between 50 and 100 as follows:
100 - 50 = 50
1/4 of 50 = 12.5
The answer 12.5 represents the number of units, but to arrive at the correct value, 12.5 must be added to the lower number in column B as follows:
50 + 12.5 = 62.5
The interpolation has been completed and 62.5 is the actual value
which is 1/4 of the range of column B.
Another method of interpolation is shown below:
Using the same numbers as in the previous example, a proportion
problem based on the relationship of the number can be set up.
The answer 12.5 must be added to 50 to arrive at the actual value
of 62.5.
The following example illustrates the use of interpolation applied
to a problem dealing with one aspect of airplane performance:
Temperature (°F) Takeoff Distance (ft)
70 1,173
80 1,356
If a distance of 1,173 feet is required for takeoff when the temperature
is 70° F and 1,356 feet for 80° F, what distance is required when
the temperature is 75° F? The solution to the problem can be determined
as follows:
Performance Charts
Following are descriptions of various performance charts. The information on these charts is not intended for operational use, but rather for familiarization and study. Because performance charts are developed for each specific make, model, and type of airplane, care must be exercised by the pilot to assure that the chart developed for the specific airplane flown is used when seeking performance data.
Density Altitude Charts
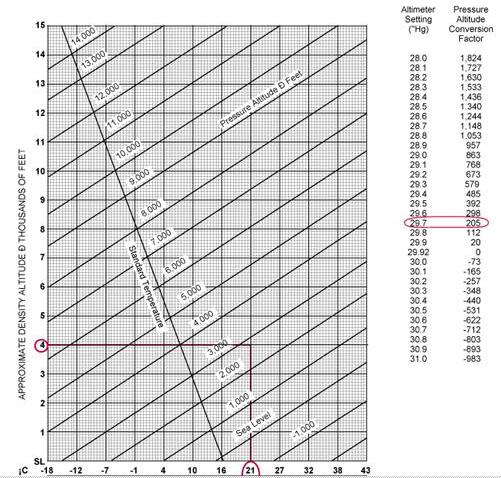
Various methods can be used to determine density altitude, one of which is charts. Figure 4-8 illustrates a typical density altitude chart. The following is an example of a density altitude problem based on figure 4-8.
Given:
Airport Elevation 2,545 ft
Outside Air Temperature 70° F
Altimeter Setting 29.70 in. Hg.
|
|
Step 1—Find the pressure altitude by locating the altimeter setting of 29.70 in. Hg. and noting the pressure altitude conversion factor. The conversion factor is either added or subtracted from the airport elevation as indicated. In this case, the factor is 205 and should be added. The pressure altitude is 2,750 feet (2,545 + 205 = 2,750).
Step 2—Locate the outside air temperature of 70° F at the bottom of the chart and draw a vertical line until it intersects with the pressure altitude of 2,750 feet. (The pressure altitude of 2,750 feet is located about three-fourths up between the 2,000 and 3,000-foot lines.)
Step 3—From where the temperature and pressure altitude lines intersect, draw a straight line to the left to determine the density altitude. The density altitude is 4,000 feet.
Takeoff Data Charts
Takeoff data charts are found in many Airplane Flight Manuals or Pilot’s Operating Handbooks. From this chart, the pilot can determine (1) the length of the takeoff ground run, and (2) the total distance required to clear a 50-foot obstacle under various airplane weights, headwinds, pressure altitudes, and temperatures. Chart formats will vary with manufacturers. Figure 4-9 shows one such chart.
The following is an example of a problem based on figure 4-9.
Given:
Gross Weight 2,200 lb
Pressure Altitude 1,000 ft
Temperature 20° C
Headwind 18 kts
Step 1—Locate the gross weight of 2,200 pounds in the first column.
Step 2—Find the pressure altitude of 1,000 feet in the pressure altitude
column corresponding to the weight of 2,200 pounds.
Step 3—Determine the ground roll by moving horizontally from the pressure
altitude to the ground roll column corresponding to the temperature of
20° C. The ground roll is 825 feet. To determine the total distance
to clear a 50-foot obstacle, move to that column. The total distance would
be 1,510 feet.
Step 4—In the notes above the chart, it states to decrease the distance
by 10 percent for each 9 knots of headwind. With an 18-knot headwind, the
takeoff roll would decrease by 20 percent (825 x 20% = 165; 825 – 165 =
660). The takeoff roll is 660 feet. The same would apply to the distance
required to clear a 50-foot obstacle which would be 1,208 feet (1,510 x
20% = 302; 1,510 – 302 = 1,208).
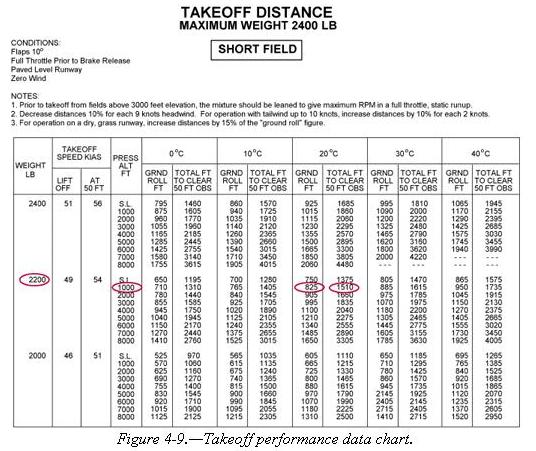 |
Step 5—If the runway is dry grass, the notes state to increase the distance by 15 percent of the ground roll. In this problem, it would require adding 15 percent of 660 feet.
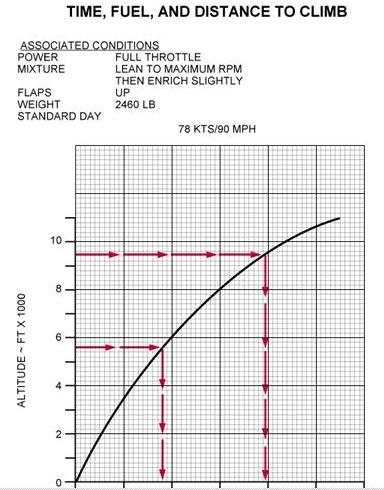
Climb and Cruise Performance Data
Climb and cruise performance are compiled from actual flight tests. This information is helpful in cross-country flight planning. Examples using different types of charts are provided as an example for determining climb performance and cruise performance.
Determine the time, fuel, and distance to climb using figure 4-10.
Given:
Airport Pressure Altitude 5,650 ft
Cruise Altitude 9,500 ft
 |
 |
Step 1—Locate the airport pressure altitude of 5,650 feet on the chart, and draw a straight line until it intersects the curved line, then draw a line to the bottom of the chart.
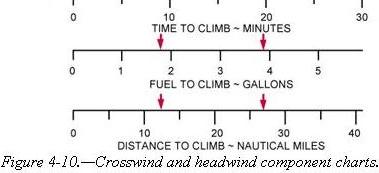
Step 2—Using the scale at the bottom of the chart, note the time, fuel, and distance to climb (9 minutes; 1.9 gallons; 12 miles).
Step 3—Repeat steps 1 and 2 using the cruise altitude of 9,500 feet (20 minutes; 3.9 gallons; 27 miles).
Step 4—Subtract the information found in step 2 from that found in step 3 (Time to climb 20 - 9 = 11 minutes; fuel to climb 3.9 - 1.9 = 2 gallons; miles to climb 27 - 12 = 15 miles).
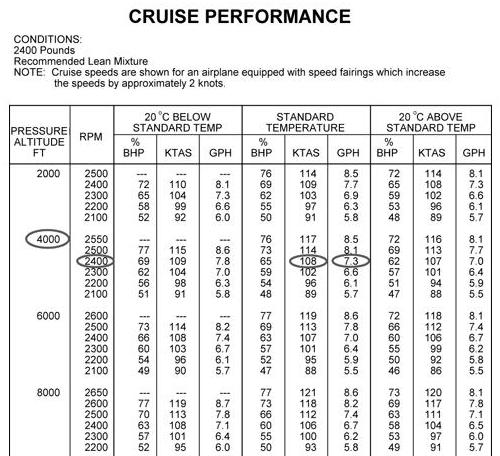
Determine the true airspeed and fuel consumption rate based on
figure 4-11.
Given:
Pressure Altitude 4,000 ft
Temperature Standard
Power 2,400 RPM
 |
 |
Step 1—Locate the pressure altitude of 4,000 feet on the chart.
Step 2—Locate 2,400 RPM in the proper column.
Step 3—Move across the chart to the standard temperature column, and note the true airspeed and fuel consumption rate (True airspeed, 108 knots; fuel consumption rate, 7.3 gallons per hour).
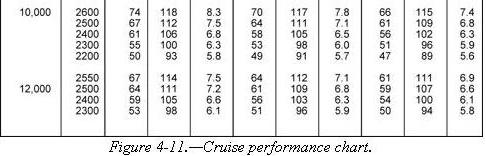
Takeoffs and landings in certain crosswind conditions are inadvisable or even dangerous. If the crosswind is strong enough to warrant an extreme drift correction, a hazardous landing condition may result. Therefore, always consider the takeoff or landing capabilities with respect to the reported surface wind conditions and the available landing directions.
| Before an airplane is type certificated by the FAA, it must be flight tested to meet certain requirements. Among these is the demonstration of being satisfactorily controllable with no exceptional degree of skill or alertness on the part of the pilot in 90° crosswinds up to a velocity equal to 0.2 Vso. This means a windspeed of two-tenths of the airplane’s stalling speed with power-off and gear and flaps down. (If the stalling speed is 60 knots, then the airplane must be capable of being landed in a 12 knot 90° crosswind.) To inform the pilot of the airplane’s capability, regulations require that the demonstrated crosswind velocity be made available. Certain Airplane Owner’s Manuals provide a chart for determining the maximum safe wind velocities for various degrees of crosswind for that particular airplane. The chart, with the example included, will familiarize pilots with a method of determining crosswind components. [Figure 4-12] | 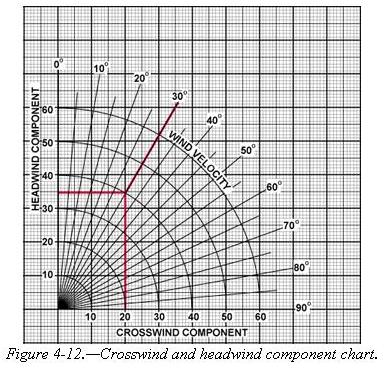 |
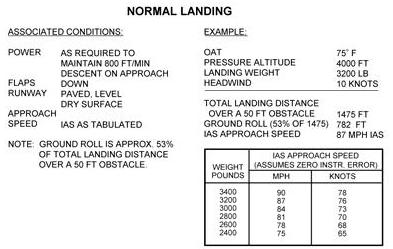
Landing Performance Data
Variables similar to those affecting takeoff distance, also affect
landing distances, although generally to a lesser extent. Consult your
Aircraft Flight Manual or Pilot’s Operating Handbook for landing distance
data, recommended flap settings, and recommended approach airspeeds.
| Combined Graphs
Some aircraft performance charts incorporate two or more graphs into one when an aircraft flight performance involves several conditions. A simple combination of graphs is illustrated in figure 4-13. It requires three functions to solve for takeoff distance with adjustments for air density, gross weight, and headwind conditions. The first function converts pressure altitude to density altitude. The right margin of this portion of the graph, even though it is not numbered, represents density altitude and starts the second function, the effect of gross weight on takeoff distance. The right margin of this section represents takeoff distance with no wind and starts the final phase of correcting for the effect of headwind. |
 |
| Determine the ground roll and total landing distance to clear a 50-foot
obstacle based on figure 4-13.
Given:
Step 1—Locate the temperature at the bottom of the chart and draw a line up the chart until it intersects the pressure altitude. From where the temperature and pressure altitude lines intersect, draw a line across to the reference line. Step 2—From the reference line, draw a line which parallels the other lines. Locate the weight at the bottom of the chart and draw a line upward until it intersects the parallel line just drawn. From that point, draw a straight line across to the next reference line.
|
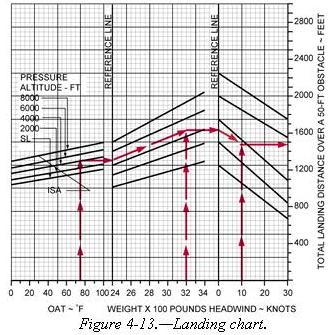 |
Step 4—The notes on the chart indicate the ground roll is 53
percent of the total landing distance (1,475 x .53 = 781.75 or 782 feet).