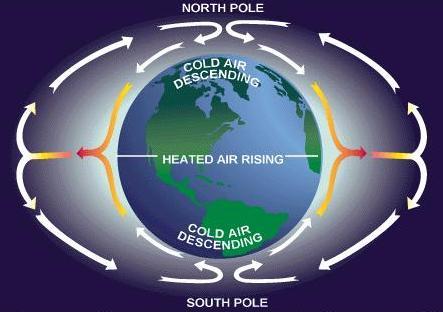
| The factor that upsets the normal equilibrium is the uneven heating of the Earth. At the Equator, the Earth receives more heat than in areas to the north and south. This heat is transferred to the atmosphere, warming the air and causing it to expand and become less dense. Colder air to the north and south, being more dense, moves toward the Equator forcing the less dense air upward. This air in turn becomes warmer and less dense and is forced upward, thus establishing a constant circulation that might consist of two circular paths; the air rising at the Equator, traveling aloft toward the poles, and returning along the Earth’s surface to the Equator, as shown in figure 5-5. |
|
| Figure 5-5.—Heat at the Equator would cause the air to circulate uniformly, as shown, if the Earth did not rotate. |
 |
This theoretical pattern, however, is greatly modified by many forces,
a very important one being the rotation of the Earth. In the Northern Hemisphere,
this rotation causes air to deflect to the right of its normal path. In
the Southern Hemisphere, air is deflected to the left of its normal path.
For simplicity, this discussion will be confined to the motion of air in
the Northern Hemisphere. [Figure 5-6]
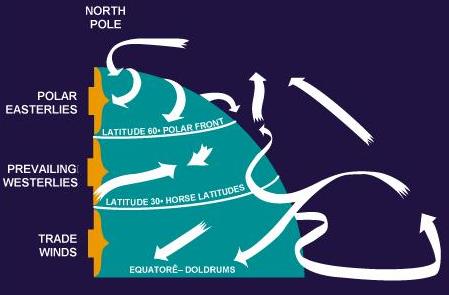
As the air rises and moves northward from the Equator, it is deflected toward the east, and by the time it has traveled about a third of the distance to the pole, it is no longer moving northward, but eastward. This causes the air to |
| Figure 5-6.—Principal air currents in the Northern Hemisphere. |
A portion of the air aloft continues its journey northward, being cooled en route, and finally settles down near the pole, where it begins a return trip toward the Equator. Before it has progressed very far southward, it comes into conflict with the warmer surface air flowing northward from latitude 30°. The warmer air moves up over a wedge of the colder air, and continues northward, producing an accumulation of air in the upper latitudes.
Further complications in the general circulation of the air are brought about by the irregular distribution of oceans and continents, the relative effectiveness of different surfaces in transferring heat to the atmosphere, the daily variation in temperature, the seasonal changes, and many other factors.
Regions of low pressure, called “lows,” develop where air lies over land or water surfaces that are warmer than the surrounding areas. In India, for example, a low forms over the hot land during the summer months, but moves out over the warmer ocean when the land cools in winter. Lows of this type are semipermanent, however, and are less significant to the pilot than the “migratory cyclones” or “cyclonic depressions” that form when unlike air masses meet. These lows will be discussed later in this chapter.
Wind Patterns
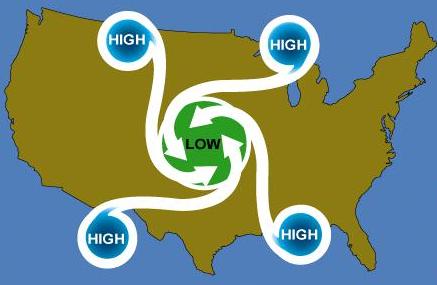
This is a discussion of wind patterns associated with areas of high and low pressure. As previously stated, air flows from an area of high pressure to an area of low pressure. In the Northern Hemisphere, during this flow, the air is deflected to the right. Therefore, as the air leaves the high pressure area, it is deflected to produce a clockwise circulation. As the air flows toward the low pressure area, it is deflected to produce a counterclockwise flow around the low pressure area.
| Another important aspect is that air moving out of a high pressure
area depletes the quantity of air. Therefore, highs are areas of descending
air. Descending air favors dissipation of cloudiness; hence the association,
high pressure—good weather. By similar reasoning, when air converges into
a low pressure area; it cannot go outward against the pressure gradient,
nor can it go downward into the ground; it must go upward. Rising air is
conducive to cloudiness and precipitation; thus the general association
low pressure—bad weather.
A knowledge of these patterns frequently enables a pilot to plan a course to take advantage of favorable winds, |
 |
|
|
 |
The theory of general circulation in the atmosphere, and the wind patterns
formed within areas of high pressure and low pressure have been discussed.
These concepts account for the large scale movements of the wind, but do
not take into consideration the effects of local conditions that frequently
cause drastic modifications in wind direction and speed near the Earth’s
surface.
Convection Currents Certain kinds of surfaces are more effective than others in heating the air directly above them. Plowed ground, sand, rocks, and barren land give off a great deal of heat, whereas water and vegetation tend to absorb and retain heat. The |
|
|
| uneven heating of the air causes small local circulations
called “convection currents,” which are similar to the general circulation
just described.
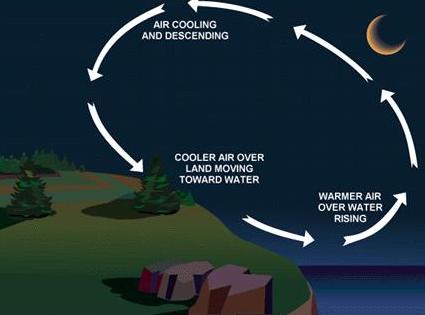
This may be particularly noticeable over land adjacent to a body of water. During the day, air over land becomes heated and less dense; colder air over water moves in to replace it forcing the warm air aloft and causing an on-shore wind. At night, the land cools, and the water is relatively warmer. The cool air over the land, being heavier, then moves toward the water as an off-shore wind, lifting the warmer air and reversing the circulation. [Figures 5-9 and 5-10] Convection currents cause the bumpiness experienced by pilots flying at low altitudes in |
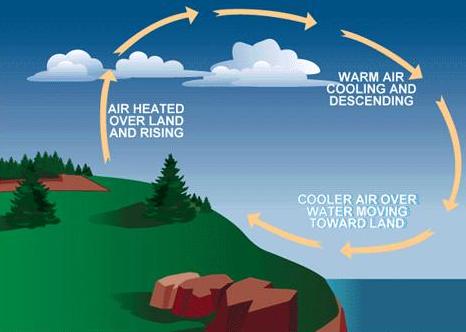 |
| Figure 5-9.—Convection currents form on-shore winds in the daytime. |
 |
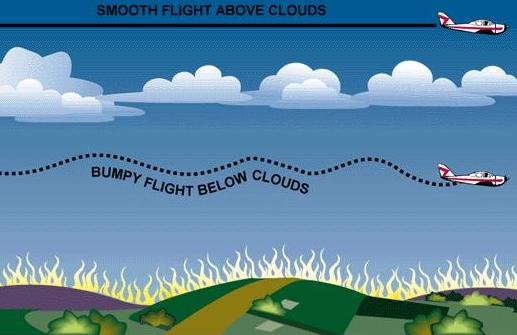 |
| Figure 5-10.—Convection currents form off-shore winds at night. | Figure 5-11.—Avoiding turbulence caused by convection currents by flying above the cloud level. |
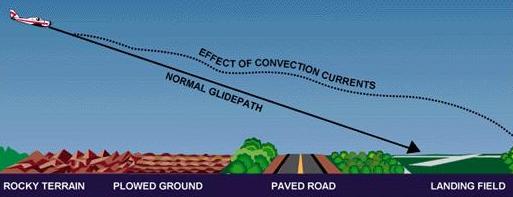 |
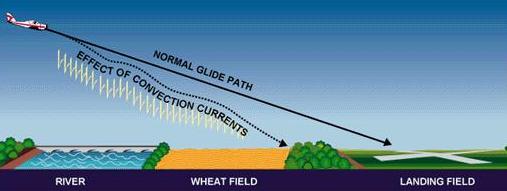
Convection currents also cause difficulty in making landings, since they affect the rate of descent. For example, a pilot flying a normal glide frequently tends to land short of or overshoot the intended landing spot, depending upon the presence and severity of convection currents. [Figures 5-12 and 5-13] |
| Figure 5-12.— Varying surfaces affect the normal glidepath. Some surfaces create rising currents which tend to cause the pilot to overshoot the field. |
| The effects of local convection, however, are less dangerous
than the turbulence caused when wind is forced to flow around or over obstructions.
The only way for the pilot to avoid this invisible hazard is to be forewarned,
and to know where to expect unusual conditions.
|
 |
| Figure 5-13.—Descending currents prevail above some surfaces and tend to cause the pilot to land short of the field. |
Effect of Obstructions on Wind
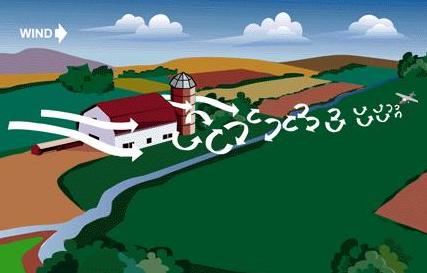 |
When the wind flows around an obstruction, it breaks into eddies—gusts with sudden changes in speed and direction—which may be carried along some distance from the obstruction. A pilot flying through such turbulence should anticipate the bumpy and unsteady flight that may be encountered. This turbulence—the intensity of which depends upon the size of the obstacle and the velocity of the wind—can present a serious hazard during takeoffs and landings. For example, during landings, it can cause an aircraft to “drop in;” during takeoffs, it could cause the aircraft to fail to gain enough altitude to clear low objects in its path. Any landings or takeoffs attempted under gusty conditions should be made at higher speeds, to maintain adequate control during such conditions. [Figure 5-14] |
| Figure 5-14.—Turbulence caused by obstructions. |
| The stronger the wind, the greater the downward pressure and the accompanying turbulence. Consequently, in approaching a hill or mountain from the leeward side, a pilot should gain enough altitude well in advance. Because of these downdrafts, it is recommended that mountain ridges and peaks be cleared by at least 2,000 feet. If there is any doubt about having adequate clearance, the pilot should turn away at once and gain more altitude. Between hills or mountains, where there is a canyon or narrow valley, the wind will generally veer from its normal course and flow through the passage with increased velocity and turbulence. A pilot flying over such terrain needs to be alert for wind shifts, and particularly cautious if making a landing. |  |
| Figure 5-15.—Airplanes approaching hills or mountains from windward are helped by rising currents. Those approaching from leeward encounter descending currents. |
Wind shear is best described as a change in wind direction and/or speed
within a very short distance in the atmosphere. Under certain conditions,
the atmosphere is capable of producing some dramatic shears very close
to the ground; for example, wind direction changes of 180° and speed
changes of 50 knots or more within 200 feet of the ground have been observed.
This, however, is not something encountered every day. In fact, it is unusual,
which makes it more of a problem. It has been thought that wind cannot
affect an aircraft once it is flying except for drift and groundspeed.
This is true with steady winds or winds that change gradually. It isn’t
true, however, if the wind changes faster than the aircraft mass can be
accelerated or decelerated.
The most prominent meteorological phenomena that cause significant
low-level wind shear problems are thunderstorms and certain frontal systems
at or near an airport.
Basically, there are two potentially hazardous shear situations. First, a tailwind may shear to either a calm or headwind component. In this instance, initially the airspeed increases, the aircraft tends to pitch up, and the altitude may increase. Second, a headwind may shear to a calm or tailwind component. In this situation, initially the airspeed decreases, the aircraft pitches down, and the altitude decreases. Aircraft speed, aerodynamic characteristics, power/weight ratio, powerplant response time, and pilot reactions along with other factors have a bearing on wind shear effects. It is important, however, to remember that shear can cause problems for any aircraft and any pilot.
There are two atmospheric conditions that cause the type of low-level
wind shear discussed herein. They are thunderstorms and fronts.
The winds around a thunderstorm are complex. Wind shear can be
found on all sides of a cell. The wind shift line or gust front associated
with thunderstorms can precede the actual storm by up to 15 nautical miles.
Consequently, if a thunderstorm is near an airport of intended landing
or takeoff, low-level wind shear hazards may exist. At some large airports
a low-level wind shear alert system (LLWAS) has been installed which aids
in detecting wind shear.
While the direction of the winds above and below a front can be accurately determined, existing procedures do not provide precise and current measurements of the height of the front above an airport. The following is a method of determining the approximate height of the front, with the consideration that wind shear is most critical when it occurs close to the ground.
• A cold front wind shear occurs just after the front passes the airport and for a short period thereafter. If the front is moving 30 knots or more, the frontal surface will usually be 5,000 feet above the airport about 3 hours after the frontal passage.
• With a warm front, the most critical period is before the front passes the airport. Warm front windshear may exist below 5,000 feet for approximately 6 hours; the problem ceases to exist after the front passes the airport. Data compiled on wind shear indicate that the amount of shear in warm fronts is much greater than that found in cold fronts.
• Turbulence may or may not exist in wind shear conditions. If the surface wind under the front is strong and gusty, there will be some turbulence associated with wind shear.
The pilot should be alert to the possibilities of low-level wind shear at any time the conditions stated are present.
Wind and Pressure Representation on Surface Weather Maps
The excerpted portion of a surface weather map provides information
about winds at the surface. The wind direction at each station is shown
by an arrow. The arrowhead is represented by the station circle, and points
in the direction toward which the wind is blowing. Winds are given the
name of the direction from which they blow; a northwest wind is a “wind
blowing from the northwest.” [Figure 5-16]
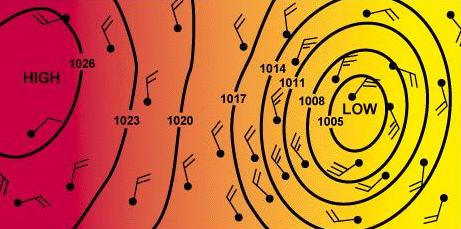 |
Windspeed is shown by “barbs” and/or “pennants” placed on the end of the arrow. The speed is indicated by the number of half barbs, full barbs, or pennants. Each half barb represents approximately 5 knots, each full barb indicates approximately 10 knots, and each pennant 50 knots. Thus two and one-half barbs indicate a windspeed of approximately 25 knots; a pennant and two and one-half barbs indicate a windspeed of approximately 75 knots, etc. |
| Figure 5-16.—Speed and direction of wind are shown on a weather map by wind arrows and isobars. |
| However, instead of indicating altitude of terrain and
steepness of slopes, isobars indicate the amount of pressure and steepness
of pressure gradients. If the gradient (slope) is steep, the isobars will
be close together, and the wind will be strong. If the gradient is gradual,
the isobars will be far apart, and the wind gentle. [Figure 5-17]
Isobars furnish valuable information about winds in the first few thousand feet above the surface. Close to the Earth, wind direction is modified by the contours over which it passes, and windspeed is reduced by friction with the surface. At levels 2,000 or 3,000 feet above the surface, however, the speed is greater and the direction is usually parallel to the isobars. Thus, while wind arrows on the weather map excerpt indicate wind near the surface, isobars indicate winds at slightly higher levels. [Figure 5-16] In the absence of specific information on upper wind conditions, the pilot can often make a fairly reasonable estimate of the wind conditions in the lower few thousand feet on the basis of the observed surface wind. Generally, it will be found that the wind at an altitude of 2,000 feet above the surface will veer about 20° to 40° to the right and almost double in speed. The veering will be greatest over rough terrain and least over flat surfaces. Thus, a north wind of 20 knots at the airport would be likely to change to a northeast wind of 40 knots at 2,000 feet. This subject will be reviewed later in this chapter. |
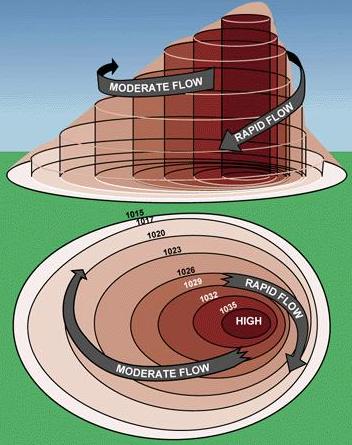 |
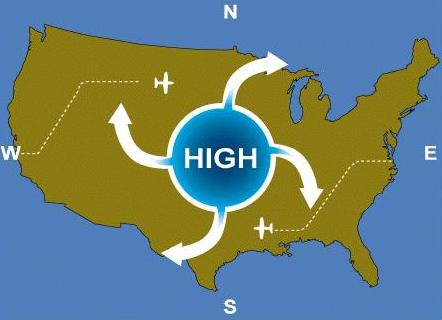
| Figure 5-17.—Above: Flow of air around a “high.” Below: Isobars on a weather map indicate various degrees of pressure within a high. |