Large, high pressure systems frequently stagnate over large areas of land or water with relatively uniform surface conditions. They take on characteristics of these “source regions”—the coldness of polar regions, the heat of the tropics, the moisture of oceans, or the dryness of continents.
As they move away from their source regions and pass over land or sea, the air masses are constantly being modified through heating or cooling from below, lifting or subsiding, absorbing or losing moisture. Actual temperature of the air mass is less important than its temperature in relation to the land or water surface over which it is passing. For example, an air mass moving from polar regions usually is colder than the land and sea surfaces over which it passes. On the other hand, an air mass moving from the Gulf of Mexico in winter usually is warmer than the territory over which it passes.
If the air is colder than the surface, it will be warmed from below and convection currents will be set up, causing turbulence. Dust, smoke, and atmospheric pollution near the ground will be carried upward by these currents and dissipated at higher levels, improving surface visibility. Such air is called “unstable.”
Conversely, if the air is warmer than the surface, there is no tendency for convection currents to form, and the air is smooth. Smoke, dust, etc., are concentrated in lower levels, with resulting poor visibility. Such air is called “stable.”
From the combination of the source characteristics and the temperature relationship just described, air masses can be associated with certain types of weather.
The following are general characteristics of certain air masses
but they may vary considerably.
Characteristics of a Cold (Unstable) Air Mass
• Type of clouds—cumulus and cumulonimbus.
• Ceilings—generally unlimited (except during precipitation).
• Visibility—excellent (except during precipitation).
• Unstable air—pronounced turbulence in lower levels (because of convection
currents).
• Type of precipitation—occasional local thunderstorms or showers -
hail, sleet, snow flurries.
Characteristics of a Warm (Stable) Air Mass
• Type of clouds—stratus and stratocumulus (fog, haze).
• Ceilings—generally low.
• Visibility—poor (smoke and dust held in lower levels).
• Stable air—smooth, with little or no turbulence.
• Type of precipitation—drizzle.
When two air masses meet, they will not mix readily unless their temperatures, pressures, and relative humidities are very similar. Instead, they set up boundaries called frontal zones, or “fronts,” the colder air mass projecting under the warmer air mass in the form of a wedge. This condition is termed a “stationary front,” if the boundary is not moving.
Usually, however, the boundary moves along the Earth’s surface, and as one air mass withdraws from a given area, it is replaced by another air mass. This action creates a moving front. If warmer air is replacing colder air, the front is called “warm;” if colder air is replacing warmer air, the front is called “cold.”
Warm Front
When a warm front moves forward, the warm air slides up over the
wedge of colder air lying ahead of it.
Warm air usually has high humidity. As this warm air is lifted,
its temperature is lowered. As the lifting process continues, condensation
occurs, low nimbostratus and stratus clouds form, and drizzle or rain develops.
The rain falls through the colder air below, increasing its moisture content
so that it also becomes saturated. Any reduction of temperature in the
colder air, which might be caused by upslope motion or cooling of the ground
after sunset, may result in extensive fog.
|
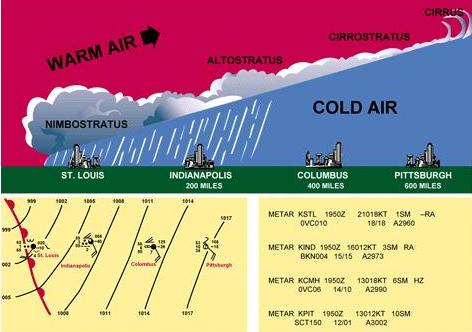
As the warm air progresses up the slope, with constantly falling temperatures, clouds appear at increasing heights in the form of altostratus and cirrostratus, if the warm air is stable. If the warm air is unstable, cumulonimbus clouds and altocumulus clouds will form and frequently produce thunderstorms. Finally, the air is forced up near the stratosphere, and in the freezing temperatures at that level, the condensation appears as thin wisps of cirrus clouds. The upslope movement is very gradual, rising about 1,000 feet every 20 miles. Thus, the cirrus clouds, forming at perhaps 25,000 feet altitude, may appear as far as 500 miles in advance of the point on the ground which marks the position of the front. [Figure 5-22] |
| Figure 5-22.—A warm front: (upper) cross-section; (lower left) as shown on a weather map; (lower right) as shown in an aviation routine weather report (METAR). |
Flight Toward an Approaching Warm Front
Although no two fronts are exactly alike, a clearer understanding
of the general pattern may be gained if the atmospheric conditions which
might exist when a warm front is moving eastward from St. Louis, MO, is
considered. [Figure 5-22]
At St. Louis, the weather would be very unpleasant, with drizzle
and probably fog.
At Indianapolis, IN, 200 miles in advance of the warm front, the sky would be overcast with nimbostratus clouds, and continuous rain.
At Columbus, OH, 400 miles in advance, the sky would be overcast with stratus and altostratus clouds predominating. The beginning of a steady rain would be probable.
At Pittsburgh, PA, 600 miles ahead of the front, there would probably
be high cirrus and cirrostratus clouds.
If a flight was made from Pittsburgh to St. Louis, ceiling and
visibility would decrease steadily. Starting under bright skies, with unlimited
ceilings and visibilities, lower stratus-type clouds would be noted as
Columbus was approached, and soon afterward precipitation would be encountered.
After arriving at Indianapolis, the ceilings would be too low for further
flight. Precipitation would reduce visibilities to practically zero. Thus,
it would be wise to remain in Indianapolis until the warm front had passed,
which might require a day or two.
If a return flight to Pittsburgh was made, it would be recommended to wait until the front had passed beyond Pittsburgh, which might require three or four days. Warm fronts generally move at the rate of 10 to 25 MPH. On the trip from Pittsburgh to Indianapolis, a gradual increase in temperature would have been noticed, and a much faster increase in dewpoint until the two coincided. Also the atmospheric pressure would gradually lessen because the warmer air aloft would have less weight than the colder air it was replacing. This condition illustrates the general principle that a falling barometer indicates the approach of stormy weather.
Cold Front
When a cold front moves forward, it acts like a snow plow, sliding under the warmer air and forcing it aloft. This causes the warm air to cool suddenly and form cloud types that depend on the stability of the warm air.
Fast-Moving Cold Fronts
In fast-moving cold fronts, friction retards the front near the ground, which brings about a steeper frontal surface. This steep frontal surface results in a narrower band of weather concentrated along the forward edge of the front. If the warm air is stable, an overcast sky may occur for some distance ahead of the front, accompanied by general rain. If the warm air is conditionally unstable, scattered thunderstorms and showers may form in the warm air. At times an almost continuous line of thunderstorms may form along the front or ahead of it. These lines of thunderstorms (squall lines) contain some of the most turbulent weather experienced by pilots.
Behind the fast-moving cold front, there is usually rapid clearing, with gusty and turbulent surface winds, and colder temperatures.
Flight Toward an Approaching Cold Front
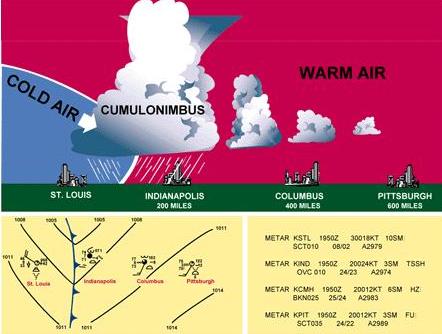
If a flight was made from Pittsburgh toward St. Louis when a cold
front was approaching from St. Louis, weather conditions quite different
from those associated with a warm front would be experienced. The sky in
Pittsburgh would probably be somewhat overcast with stratocumulus clouds
typical of a warm air mass, the air smooth, and the ceilings and visibilities
relatively low,
 |
although suitable for flight. [Figure 5-23]
As the flight proceeded, these conditions would prevail until reaching Indianapolis. At this point, it would be wise to check the position of the cold front by reviewing current weather charts and reports. It would probably be found that the front was now about 75 miles west of Indianapolis. A pilot with sound judgment, based on knowledge of frontal conditions, would remain in Indianapolis until the front had passed—a matter of a few hours—and then continue to the destination under near perfect flying conditions. If, however, through the lack of better judgment the flight was continued toward the approaching cold front, a few altostratus clouds |
| Figure 5-23.—A cold front: (upper) cross section; (lower left) as shown on a weather map; (lower right) as shown in an aviation routine weather report (METAR). |
and a dark layer of nimbostratus lying low on the horizon, with perhaps cumulonimbus in the background would be noted. Two courses would now be open: (1) either turn around and outdistance the storm, or (2) make an immediate landing which might be extremely dangerous because of gusty wind and sudden wind shifts.
If flight was continued, entrapment in a line of squalls and cumulonimbus clouds could occur. It may be unsafe to fly beneath these clouds; impossible, in a small plane, to fly above them. At low altitudes, there are no safe passages through them. Usually there is no possibility of flying around them because they often extend in a line for 300 to 500 miles.
Comparison of Cold Fronts with Warm Fronts
The slope of a cold front is much steeper than that of a warm front
and the progress is generally more rapid—usually from 20 to 35 MPH—although
in extreme cases, cold fronts have been known to move at 60 MPH. Weather
activity is more violent and usually takes place directly at the front
instead of in advance of the front. In late afternoon during the warm season,
however, squall lines frequently develop as much as 50 to 200 miles in
advance of the actual cold front. Whereas warm front dangers are low ceilings
and visibilities, and cold front dangers are chiefly sudden storms, high
and gusty winds, and turbulence.
Unlike the warm front, the cold front rushes in almost unannounced,
makes a complete change in the weather within a period of a few hours,
and then continues. Altostratus clouds sometimes form slightly ahead of
the front, but these are seldom more than 100 miles in advance. After the
front has passed, the weather often clears rapidly and cooler, drier air
with usually unlimited ceilings and visibilities prevail.
 |
Wind Shifts
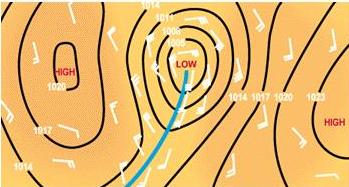
Wind shifts perhaps require further explanation. The wind in a “high” blows in a clockwise spiral. When two highs are adjacent, the winds are in almost direct opposition at the point of contact as illustrated in figure 5-24. Since fronts normally lie between two areas of higher pressure, wind shifts occur in all types of fronts, but they usually are more pronounced in cold fronts.
|
| Figure 5-24.—Weather map indication of wind shift line (center line leading to low). |
Occluded Front
One other form of front with which the pilot should become familiar is the “exclusion” or “occluded front.” This is a condition in which a warm air mass is trapped between two colder air masses and forced aloft to higher and higher levels until it finally spreads out and loses its identity.
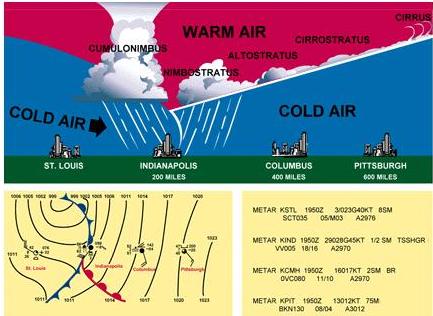 |
Meteorologists subdivide occlusions into two types, but as far as the
pilot is concerned, the weather in any occlusion is a combination of warm
front and cold front conditions. As the occlusion approaches, the usual
warm front indications prevail—lowering ceilings, lowering visibilities,
and precipitation. Generally, the warm front weather is then followed almost
immediately by the cold front type, with squalls, turbulence, and thunderstorms.
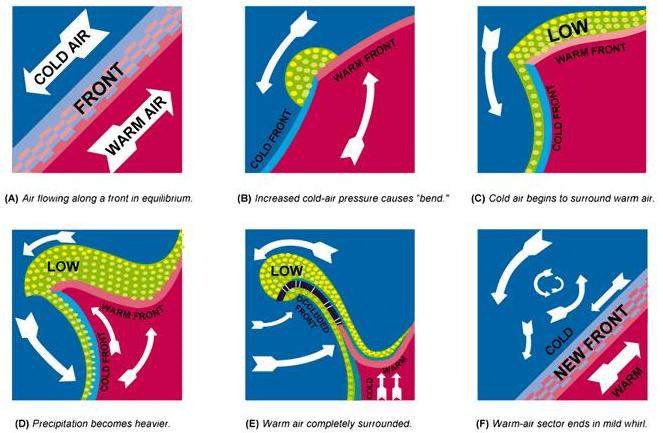
Figure 5-25 is a vertical cross section of an occlusion. Figure 5-26 shows the various stages as they might occur during development of a typical occlusion. Usually the development requires three or four |
| Figure 5-25.—An occluded front: (upper) cross section; (lower left) as shown on a weather map; (lower right) as shown in an aviation routine weather report (METAR). |
| days, during which the air mass may progress as indicated
on the map.
The first stage (A) represents a boundary between two air masses, the cold and warm air moving in opposite directions along a front. Soon, however, the cooler air, being more aggressive, thrusts a wedge under the warm air, breaking the continuity of the boundary, as shown in (B). Once begun, the process continues rapidly to the complete occlusion as shown in (C). As the warmer air is forced aloft, it cools quickly and its moisture condenses, often causing heavy precipitation. The air becomes extremely turbulent, with sudden changes in pressure and temperature. |
 |
| Figure 5-26.—Three stages in the development of a typical occlusion moving northeastward. |
 |
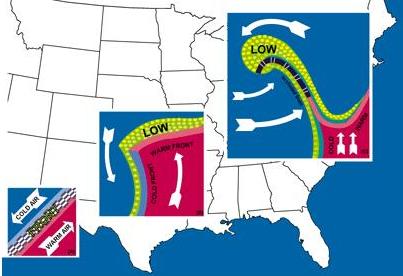
| Figure 5-27.—Development of an occlusion. If warm air were red and cold air were blue, this is how various stages of an occlusion would appear to a person aloft looking toward the Earth. (Precipitation is green.) |
Figure 5-27 shows the development of the occluded front in greater detail.
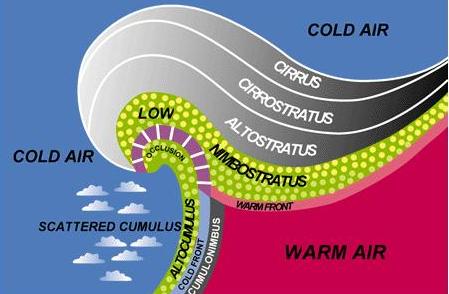 |
Figure 5-28 is an enlarged view of (C) in Figure 5-26, showing the cloud formations and the areas of precipitation. In figures 5-22, 5-23, and 5-25, a panel representing a surface weather map is placed below each cross-sectional view. These panels represent a bird’s eye or plan view, and show how the weather conditions are recorded. A warm front is indicated by a red line, a cold front by a blue line, an occluded front by a purple line, and a stationary front by alternating red and blue dashes. The rounded and pointed projections are generally omitted from manuscript maps, but are placed on facsimile, printed, or duplicated maps to distinguish the different fronts. |
| Figure 5-28.—Cloud formations and precipitation accompanying a typical occlusion. |
A frontal line on the weather map represents the position of the frontal surface on the Earth’s surface. A pilot flying west at an altitude of 6,500 feet would pass through the frontal boundary about 100 miles in advance of the point where the warm front is shown, or about 25 to 50 miles to the rear of the line on the map representing the cold front.
Figure 5-29 is a section of a surface weather map as transmitted on facsimile. It shows a low pressure center with warm, cold, and occluded fronts.
The preceding discussion categorizes weather with types of fronts. However, weather with a front depends more on the characteristics of the conflicting air masses than on the type of front. A pilot should not attempt to determine expected weather from fronts and pressure centers on the surface chart alone. The pilot must rely heavily on other charts, reports, and forecasts which are discussed in the next section of this chapter.