![]()
|
|
||
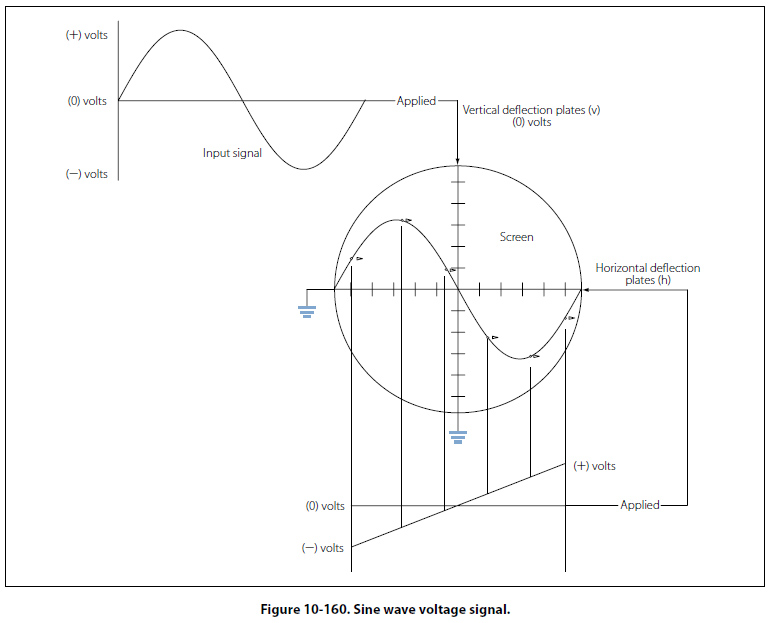
Vertical Deflection If this same signal were applied to the vertical plates, it would also produce a vertical line by causing the beam to trace from the down position to the up position. Tracing a Sine Wave Reproducing the sine wave on the oscilloscope combines both the vertical and horizontal deflection patterns. [Figure 10-160] If the sine wave voltage signal is applied across the vertical deflection plates, the result will be the vertical beam oscillation up and down on the screen. The amount that the beam moves above the centerline will depend on the peak value of the voltage.
While the beam is being swept from the left to the right by the horizontal plates, the sine wave voltage is being applied to the vertical plates, causing the form of the input signal to be traced out on the screen. Control Features on an Oscilloscope While there are many different styles of oscilloscopes, which range from the simple to the complex, they all have some controls in common. Apart from the screen and the ON/OFF switch, some of these controls are listed below. Horizontal Position: allows for the adjustment of the neutral horizontal position of the beam. Use this control to reposition the waveform display in order to have a better view of the wave or to take measurements. Vertical Position: moves the traced image up or down allowing better observations and measurements. Focus: controls the electron beam as it is aimed and converges on the screen. When the beam is in sharp focus, it is narrowed down to a very fine point and does not have a fuzzy appearance. Intensity: essentially the brightness of the trace. Controlling the flow of electrons onto the screen varies the intensity. Do not keep the intensity too high for extended testing or when the beam is motionless and forms a dot on the screen. This can damage the screen. Seconds/Division: a time-based control, which sets the horizontal sweep rate. Basically, the switch is used to select the time interval that each division on the horizontal scale will represent. These divisions can be seconds, milliseconds or even microseconds. A simple example would be if the technician had the seconds/division control set to 10 µS. If this technician is viewing a waveform that has a period of 4 divisions on the screen, then the period would be 40 µS. The frequency of this waveform can then be determined by taking the inverse of the period. In this case, 1/40 µS will equal a frequency of 25 kHz. Volts/Division: used to select the voltage interval that each division on the vertical scale will represent. For example, suppose each vertical division was set to equal 10 mV. If a waveform was measured and had a peak value of 4 divisions, then the peak value in voltage would be 40 mV Trigger: The trigger control provides synchronization between the saw-tooth horizontal sweep and the applied signal on the vertical plates. The benefit is that the waveform on the screen appears to be stationary and fixed and not drifting across the screen. A triggering circuit is used to initiate the start of a sweep rather than the fixed saw-tooth sweep rate. In a typical oscilloscope, this triggering signal comes from the input signal itself at a selected point during the signal’s cycle. The horizontal signal goes through one sweep, retraces back to the left side and waits there until it is triggered again by the input signal to start another sweep. |
| ©AvStop Online Magazine Contact Us Return To Books |