GRAPHSANDCHARTS
| GRAPHS AND CHARTS
Graphs and charts are pictorial presentations of data, equations, and
formulas. Through their use the relationship between two or more quantities
may be more clearly understood. Also, a person can see certain conditions
or relationships at a glance, while it would require considerable time
to obtain the same information from a written description. Graphs may be
used in a number of ways, such as representing a single equation or formula,
or they may be used to solve two equations for a common value.
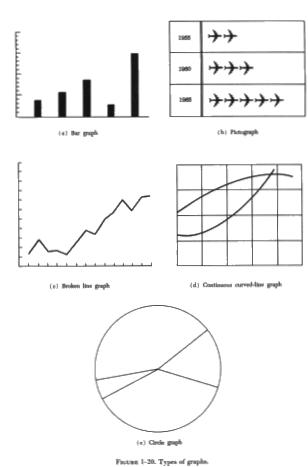
Graphs and charts take many forms. A few of the more common forms are
called bar graphs, pictographs, broken line graphs, continuous curved line
graphs, and circle graphs. An example of each is shown in figure 1-20.
The most useful of these graphs in technical work is the continuous curved
line graph.
Interpreting/Reading
Interpreting or Reading Graphs and Charts |
|
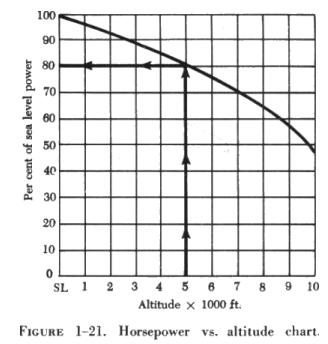 |
It is more important, from the mechanic's viewpoint, to be able to
read a graph properly than it is to draw one. The relationship between
the horsepower of a certain engine at sea level and at any altitude up
to 10,000 feet can be determined by use of the chart in figure 1-21. To
use this type of chart, simply find the point on the horizontal axis that
represents the desired altitude; move upward along this line to the point
where it intersects the curved line; then move to the left, reading the
percent of sea level horsepower available on the vertical axis.
EXAMPLE
What percent of the sea level horsepower is available at an altitude
of 5,000 feet?
FIRST: Locate the point on the horizontal axis that represents 5,000
feet. Move upward to the point where the line intersects the curved line. |
NEXT: Move to the left, reading the percent of sea level horsepower
available at 5,000 feet. The available horsepower is 80%.
Nomograms
It is often necessary to make calculations using the same formula, but
using different sets of values for the variables. It is possible to obtain
a solution by use of a slide rule or by preparing a table giving the solution
of the formula resulting from successive changes of each variable. However,
in the case of formulas involving several mathematical operations, the
labor entailed would usually be very great.
It is possible to avoid all this labor by using a diagram representing
the formula, in which each variable is represented by one or more graduated
lines. From this diagram, the solution of the formula for any given variable
may be read by means of an index line. A diagram of this type is known
as a nomogram.
Much of the information needed to solve aeronautical problems will be
presented in nomogram form. Instruction manuals for the various aircraft
contain numerous nomograms, many of which appear quite complex.
Many of the presentations will possess several curves on the same coordinate
axis, each curve drawn for different constants in the equation. In the
latter case, it is essential to select the proper curve for the desired
conditions.
Again, as with the simpler graphs, it is more important for the mechanic
to be able to read nomograms than it is to draw them.
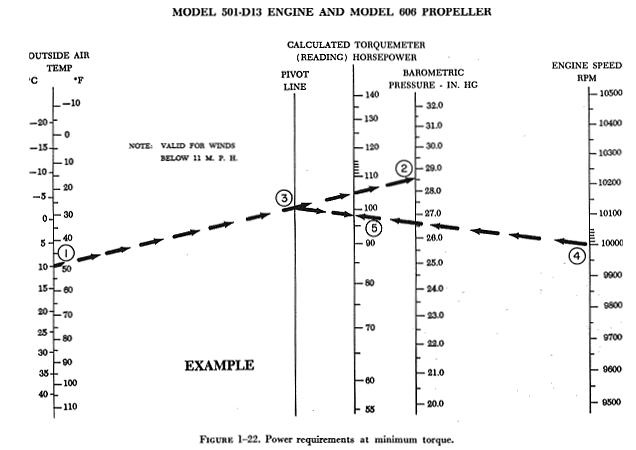
The following example is taken from the maintenance manual for the Allison
501-D13 turboprop engine. A nomogram (figure 1-22) is used to determine
the power requirements when the engine is operating at minimum torque.
The OAT (outside air temperature), station barometric pressure, and engine
rpm are three factors that must be known to use this particular nomogram.
EXAMPLE
Determine the calculated horsepower of a certain engine, using the nomogram
in figure 1-22. Assume that the OAT is 10° C, the barometric pressure
is 28.5 in Hg, and the engine is operating at 10,000 rpm.
FIRST: Locate the reference points on the OAT scale and on the barometric
pressure scale that correspond to the given temperature and pressure readings.
These are identified as 1 and 2 respectively, on the chart. With the aid
of a straightedge, connect these two points and establish point 3 on the
pivot line.
NEXT: Locate the engine speed, identified as 4 on the engine speed rpm
scale. Using a straightedge, connect points 3 and 4 and establish point
5 on the calculated horsepower scale. The calculated horsepower is read
at point 5. The calculated horsepower is 98%.