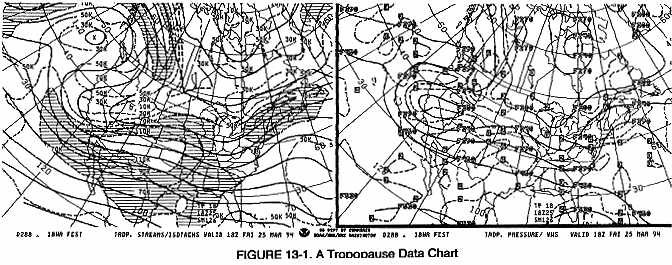
TROPOPAUSE DATA CHART
The tropopause data chart is a two-panel chart containing a maximum wind prog and a vertical wind shear prog. The chart is prepared for the contiguous 48 states (Figure 13-1) and is available once a day with a valid time of 18Z.
DOMESTIC TROPOPAUSE WIND AND WIND SHEAR PROGS
Both panels show forecast parameters at the tropopause level. The first panel depicts the forecast winds at the tropopause and the second panel gives the tropopause height and vertical wind shear (VWS).
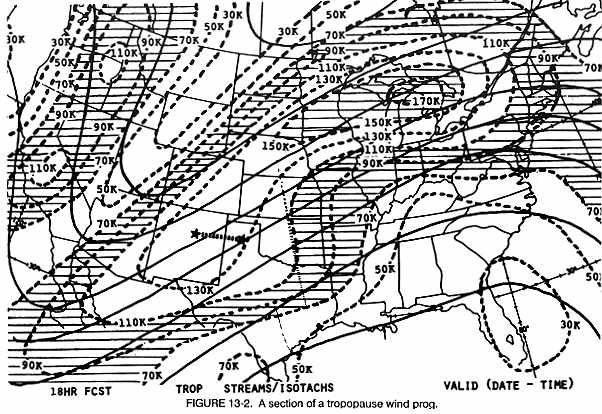
Tropopause Winds
The tropopause winds prog, Figure 13-2, depicts wind direction by streamlines. The streamlines are the solid lines that are not labeled. Since winds parallel the streamlines and generally flow from west to east, direction can be obtained by following the streamline flow. A high or low may be encircled by a closed streamline. Determining if a closed streamline is a high or low is done by remembering the circulation around these systems.
Wind speed is shown by isotachs at 20-knot intervals. The isotachs are the dashed lines and are labeled in knots. Areas of wind speeds between 70 and 110 knots are hatched as are wind speeds between 150 and 190 knots. Note that the shading criteria is the same as used on the higher level constant pressure analysis and progs.
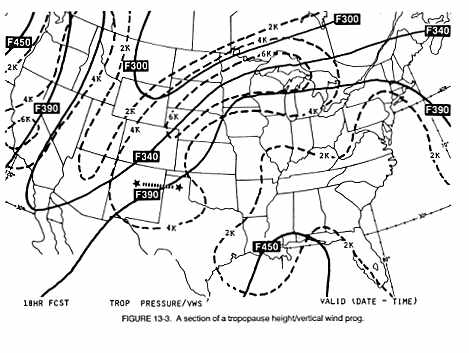
Tropopause Height/Vertical Wind Shear (VWS)
The tropopause height/vertical wind shear prog (Figure 13-3) depicts the height of the tropopause in terms of pressure altitude and vertical wind shear in knots per 1,000 feet. For an explanation of vertical wind shear, see AVIATION WEATHER, AC 00-6A, Chapter 3. The solid lines trace intersections of the tropopause with standard constant pressure surfaces. Heights are preceded by the letter "F" and are in hundreds of feet.
Vertical wind shear is in knots per 1,000 feet and is depicted by dashed lines at 2-knot intervals. Wind shear is averaged through a layer from about 8,000 feet below to 4,000 feet above the tropopause.
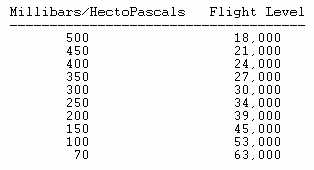
The following is a list of pressure and corresponding flight levels:
Millibars/HectoPascals Flight Level
|
USING THE PANELS
The progs are issued once daily and may be used for a period of up to plus or minus 6 hours from the valid time. The panels may be used to determine vertical and horizontal wind shear as clues to probable wind shear turbulence. The charts may be also used to determine winds for high level flight planning.
Although neither panel depicts the jet stream, locating the jet is not difficult. The jet passes through the isotach and vertical shear maxima. For example, (Figure 13-2) a jet maximum extends from eastern Washington and Oregon extending south and slightly west through central California. It reappears near the southwest corner of the panels, and enters the U.S. near the Arizona-New Mexico border. The jet then extends northeast across central Nebraska and swings east through the central Great Lakes and into southern New England.
Horizontal wind shear can be determined from the spacing of the isotachs. The horizontal wind shear critical for turbulence (moderate or greater) is greater than 18 knots per 150 miles. For further information, see AVIATION WEATHER, AC 00-6A, Chapter 13 on clear air turbulence. Note that 150 nautical miles is equal to about 2 1/2 degrees longitude.
For example, lay a pencil along a meridian in the Atlantic Ocean. The spacing on the longitude lines is 10 degrees. Measure 2 1/2 degrees and move the pencil perpendicular to the isotach across north central Montana. Note that the horizontal shear, the difference in wind speed, is about 40 knots along this distance. This spacing represents the wind shear critical for probable moderate or greater wind shear turbulence. The strong wind shear from southwest Arizona to northwest Minnesota suggests a probability of turbulence due to horizontal wind shear.
Vertical wind shear can be determined directly from the dashed lines in Figure 13-3. The vertical shear critical for probable turbulence is 6 knots per 1,000 feet. This critical value can be found in central California and from west Nebraska to the Great Lakes. An area of extremely high probability of moderate or greater turbulence is the three state junction of the Dakotas and Minnesota. This is where the horizontal shear is about 80 knots per 150 miles and the vertical shear is in excess of 6 knots per 1,000 feet.
Wind direction and speed at the tropopause flight level may be read directly from the streamlines and isotachs. To determine wind at a flight level below and above the tropopause, determine the direction and speed at the tropopause. Since wind direction changes very little within several thousand feet of the tropopause, this direction may be used throughout the layer for which vertical wind shear is computed. Next, determine wind shear and the number of thousands of feet the desired flight level differs from the flight level of the tropopause.
For example, assume a westbound flight wants to know the probability of turbulence and the wind for a leg from Amarillo and Albuquerque. Figure 13-2 indicates that the possibility of horizontal wind shear is negligible (less than 18 knots per 150 miles). Vertical wind shear (Figure 13-3) is interpolated between the 4- and 6- knot shear lines and is about 5 knots per 1,000 feet. Widespread significant turbulence (moderate or greater) is unlikely. Also, refer to the high-level significant weather prog and pilot reports for further information about turbulence.
Wind direction along the route, determined from the streamlines, is
about 230 degrees. Speed is strongest at the tropopause, so a westbound
flight should choose a flight level as far as practical above or below
the tropopause. For a tropopause of 39,000 feet (200 mb/hPa), a flight
level at 43,000 would be appropriate. Figure 13-2
indicates the wind at the tropopause to be on the high side of the 130
knot isotach. A good estimate would be a speed of 135 knots. The flight
level of 43,000 feet is 4,000 feet above the tropopause. Multiply the 5-knot
shear by four. Subtract the 20 knots from 135, the wind speed at the tropopause,
to obtain a speed of 115 knots. Therefore, the wind speed at FL430 is approximately
230 degrees at 115 knots.