VOLCANIC ASH FORECAST TRANSPORT AND DISPERSION CHART
The Volcanic Ash Forecast Transport and Dispersion (VAFTAD) Chart, Figures 14-2 and 14-3, is generated by a 3-dimensional time-dependent dispersion model developed by NOAA's Air Resources Laboratory (ARL). The VAFTAD model focuses on hazards to aircraft flight operations caused by a volcanic eruption with an emphasis on the ash cloud location in time and space. It uses National Meteorological Center (NMC) forecast data to determine the location of ash concentrations over 6-hour and 12-hour time intervals, with valid times beginning 6, 12, 24, and 36 hours following a volcanic eruption. The output is made available on graphics distribution networks supported by the NWS. This computer-prepared chart is not issued on a routine basis. Rather, it is issued as volcanic eruptions are reported.
Since the VAFTAD chart is triggered by the occurrence of a volcanic eruption, PIREPs concerning volcanic activity are very important. Initial input to the VAFTAD model run and the resulting chart includes;
-Geographic region
-Volcano name
-Volcano latitude and longitude
-Eruption date and time, and
-Initial ash cloud height.
Utilizing NMC meteorological forecast guidance, volcanic ash particle transport and dispersion is depicted horizontally and vertically through representative atmospheric layers. The model does take into account ash particle fall with the passage of time.
VAFTAD PRODUCT
The VAFTAD product presents the relative concentrations of ash following a volcanic eruption for three layers of the atmosphere in addition to a composite of ash concentration through the atmosphere.
Atmospheric layers depicted are:
-Surface to flight level 200
-Flight level 200 to flight level 350, and -Flight level 350 to flight
level 550.
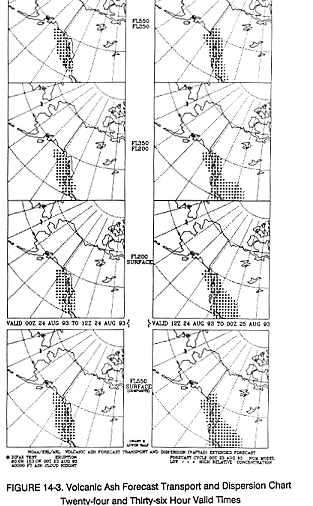
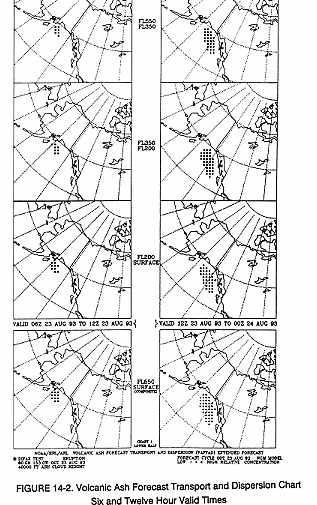
Figure 14-2 is a sample VAFTAD 8-panel chart (for DIFAX transmission) of ash cloud relative concentrations for 6 to 12 hours, and 12 to 24 hours after a volcanic eruption. Figure 14-3 is a sample chart for the 12-hour time intervals 24 to 36, and 36 to 48 hours after an eruption. Note that the first six hours after the volcanic eruption are not depicted. [An appropriate SIGMET will be issued for that period concerning the volcanic eruption and the area affected by the ash cloud.]
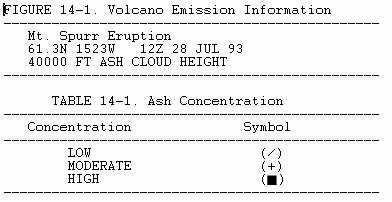
The four panels in any column are valid for the same time interval (specified and located below the third panel). The top three panels in each column provide the ash location and relative concentrations for an atmospheric layer, identified by top and bottom flight levels. The highest layer is at the top of the chart. The bottom panels are the total ash concentrations from the surface up through flight level 550. Volcano eruption information is given at the lower left (See Figure 14-1) which includes the volcano name (with location symbol), latitude and longitude, eruption date and time, and initial ash cloud height. The legend for relative concentrations (see Table 14-1) is at the lower right corner of the chart. A relative concentration symbol on a map reflects a maximum forecast value at a location during the time interval.