TABLES AND CONVERSION GRAPHS
This section provides graphs and tables that can be used operationally in decoding weather messages during preflight and inflight planning and in transmitting pilot reports. Information included covers:
1. Icing intensities and reporting.
2. Turbulence intensities and reporting.
3. Locations of probable turbulence by intensity as it relates to weather
and terrain features.
4. Standard temperature, speed, and pressure conversions.
5. Density altitude computations.
6. Selected contractions.
7. Selected acronyms.
8. Scheduled issuance and valid times of forecast products.
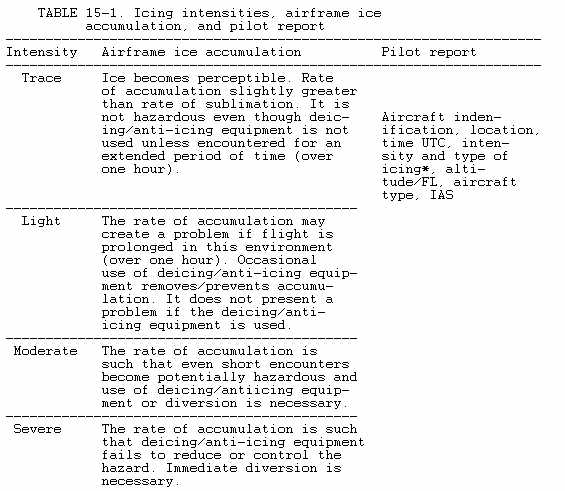
The table of Icing Intensities (Table 15-1) classifies each intensity according to its operational effects on aircraft.
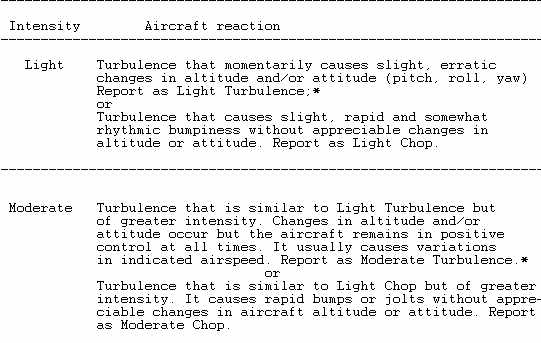
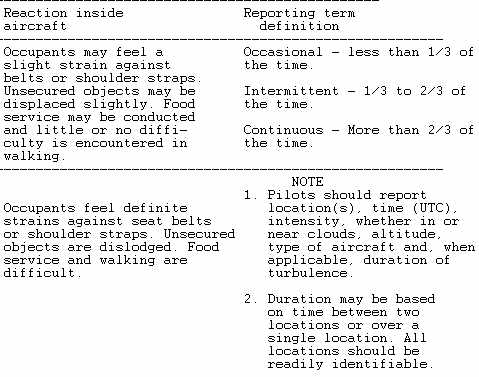
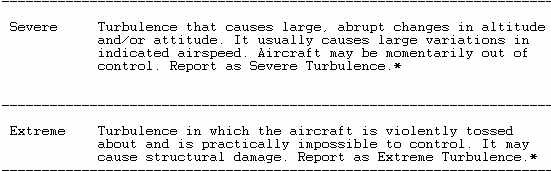
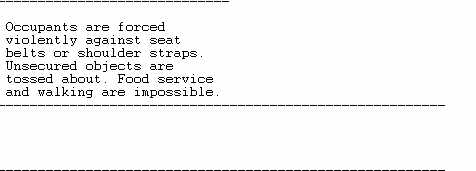
The table of Turbulence Intensities (Table 15-2) classifies each intensity according to its effects on aircraft control and structural integrity and on articles and occupants within the aircraft.
The section on Locations of Probable Turbulence lists each turbulence intensity along with terrain and weather features conducive to turbulence of that intensity.
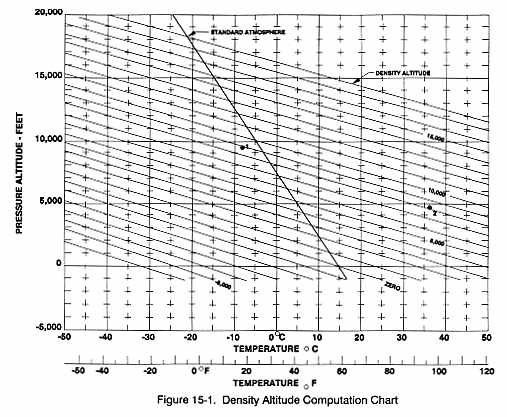
The graph for Density Altitude Computations (see Figure 15-1) provides a means of computing density altitude, either on the ground or aloft, using the aircraft altimeter and outside air temperature.
Contractions are used extensively in surface, radar, and pilot reports and in forecasts. Most of them are known from common usage or can be deciphered phonetically. The list of Selected Contractions contains only those most likely to give you difficulty. Acronyms used in this manual are defined in the list of Acronyms.
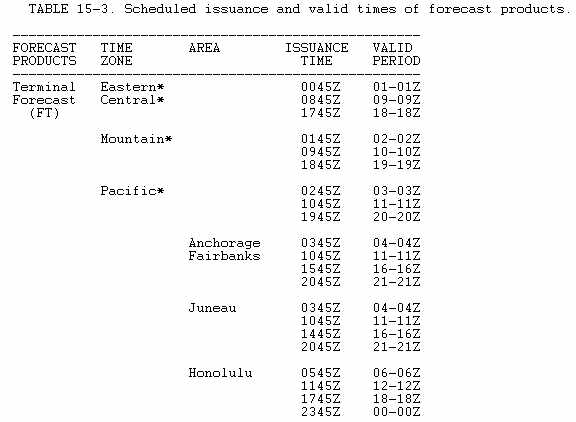
The table of Scheduled Issuance and Valid Times of Forecast Products (Table 15-3) lists forecast products, and their issuance times and valid periods.
LOCATIONS OF PROBABLE TURBULENCE BY INTENSITIES AS IT RELATES TO WEATHER AND TERRAIN FEATURES
Light Turbulence
1. In hilly and mountainous areas, even with light winds.
2. In and near small cumulus clouds.
3. In clear-air convective currents over heated surfaces.
4. With weak wind shears in the vicinity of-
a. Troughs aloft.
b. Lows aloft.
c. Jet streams.
d. The tropopause.
5. In the lower 5,000 feet of the atmosphere:
a. When winds are near 15 knots.
b. Where the air is colder than the underlying surfaces.
Moderate Turbulence
1. In mountainous areas with a wind component of 25 to 50 knots perpendicular to and near the level of the ridge:
a. At all levels from the surface to 5,000 feet above the tropopause with preference for altitudes:
(1) Within 5,000 feet of the ridge level.
(2) At the base of relatively stable layers below the base of the tropopause.
(3) Within the tropopause layer.
b. Extending downstream from the lee of the ridge for 150 to 300 miles.
2. In and near thunderstorms in the dissipating stage.
3. In and near other towering cumuliform clouds.
4. In the lower 5,000 feet of the troposphere.
a. When surface winds are 30 knots or more.
b. Where heating of the underlying surface is unusually strong.
c. Where there is an invasion of very cold air.
5. In fronts aloft.
6. Where:
a. Vertical wind shears exceed 6 knots per 1,000 feet, and/or
b. Horizontal wind shear exceed 18 knots per 150 miles.
Severe Turbulence
1. In mountainous areas with a wind component exceeding 50 knots perpendicular to and near the level of the ridge:
a. In 5,000 foot layers:
(1) At and below the ridge level in rotor clouds or rotor action.
(2) At the tropopause.
(3) Sometimes at the base of other stable layers below the tropopause.
b. Extending downstream from the lee of the ridge for 50 to 150 miles.
2. In and near growing and mature thunderstorms.
3. Occasionally in other towering cumuliform clouds.
4. 50 to 100 miles on the cold side of the center of the jet stream,
in troughs aloft, and in lows aloft where:
a. Vertical wind shear exceeds 10 knots per 1,000 feet, and
b. Horizontal wind shear exceeds 40 knots per 150 miles.
Extreme Turbulence
1. In mountain wave situations, in and below the level of well-developed
rotor clouds. Sometime it extends to the ground.
2. In severe thunderstorms (most frequently in organized squall lines)
indicated by:
a. Large hailstones (diameter 3/4 inch or greater)
b. Strong radar echoes, or
c. Almost continuous lightning.
DENSITY ALTITUDE COMPUTATIONS
Use the graph, Figure 15-1, to find density altitude either on the ground or aloft. Set the aircraft's altimeter at 29.92 inches, it now indicates pressure altitude. Read the outside air temperature. Enter the graph at the pressure altitude and move horizontally to the temperature. Read the density altitude from the sloping lines.
For example:
(1) Density altitude in flight. Pressure altitude is 9,500 feet and the temperature is -8 degrees C. Find 9,500 feet on the left of the graph and move to -8 degrees C. Density altitude is 9,000 feet.
(2) Density altitude for take-off. Pressure altitude is 4,950 feet and the temperature is 97 degrees F. Enter the graph at 4,950 feet and move across to 97 degrees F. Density altitude is 8,200 feet. Note that in the warm air, density altitude is considerably higher than pressure altitude.
ICING INTENSITIES
TABLE 15-1. Icing intensities, airframe ice
TURBULENCE INTENSITIES
TABLE 15-2. Turbulence reporting criteria
|
|
|
|
|