PILOT AND RADAR REPORTS AND SATELLITE PICTURES
The preceding section explained the decoding of Surface Aviation Observation reports. However, these "spot" reports are only one facet of the total current weather picture. Pilot and Radar Reports, along with satellite pictures, help to fill the gaps between stations.
PILOT WEATHER REPORTS (PIREPs)
No observation is more timely than the one made from the cockpit. In fact, aircraft in flight are the only means of directly observing cloud tops, icing, and turbulence. Other pilots welcome PIREPs as well as do the briefers and forecasters. Pilots should help themselves, the aviation public, and the aviation weather service by sending Pilot Reports.
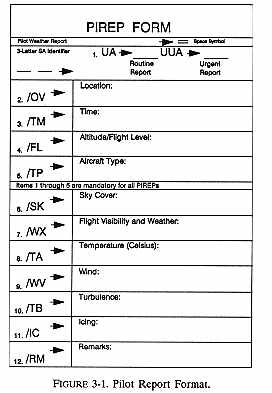
A PIREP is usually transmitted in a prescribed format (Figure
3-1). The letters "UA" identify the message as a Pilot Report. The
letters "UUA" identify an urgent PIREP. Required elements for all PIREPs
are message type, location, time, flight level, type of aircraft, and at
least one weather element encountered. When not required, elements without
reported data are omitted. All altitude references are MSL unless otherwise
noted. Distances are in nautical miles, and time is in UTC. A PIREP is
usually transmitted as an individual report but can be appended to a surface
aviation weather report or placed into collectives. The phenomenon is coded
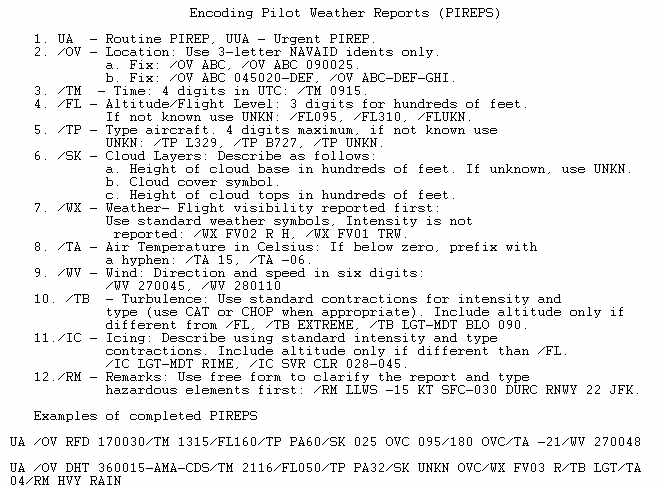
in contractions and symbols. For example (refer to Figure 3-1 as a guide):
|
Examples of completed PIREPS
UA /OV RFD 170030/TM 1315/FL160/TP PA60/SK 025 OVC 095/180 OVC/TA -21/WV 270048
UA /OV DHT 360015-AMA-CDS/TM 2116/FL050/TP PA32/SK UNKN OVC/WX FV03 R/TB LGT/TA 04/RM HVY RAIN
FIGURE 3-1. Pilot Report Format.
UA /OV MRB-PIT/TM 1600/FL100/TP BE55/SK 024 BKN 032/042 BKN-OVC/TA -12/IC LGT-MDT RIME 055-080/RM WND COMP HEAD 020 MH310 TAS 180.
This PIREP decodes as follows: Pilot Report, Martinsburg to Pittsburgh at 1600 UTC at 10,000 feet. Type of aircraft is a Beechcraft Baron. First cloud layer has a base at 2,400 feet broken with tops at 3,200 feet. The second cloud layer has a base at 4,200 broken occasionally overcast with no tops reported. Outside air temperature is -12 degrees Celsius. Light to moderate rime icing is reported between 5,500 and 8,000 feet. The headwind component is 20 knots. Magnetic heading is 310 degrees and the true air speed is 180 knots.
The following is an example of how a PIREP would be appended to a Surface Aviation Observation.
DSM SA 1755 M8 OVC 3R-F 132/45/44/3213/992/ UA /OV DSM 320012/TM 1735/FLUNKN/ TP UNKN /SK OVC 65/080 OVC 140.
This PIREP decodes as follows: Pilot Report, 12 nautical miles on the 320 degree radial from the Des Moines VOR, at 1735 UTC. The flight level and type of aircraft is unknown. The top of the lower overcast layer of clouds is 6,500 feet. The base of the second overcast layer is at 8,000 feet with tops at 14,000 feet. Note that PIREPs, appended to an SAO must adhere to the same format shown in Figure 3-1.
UA /OV OKC 063064/TM 1522/FL080/TP C172/ TA -04/WV 245040/TB LGT/RM IN CLR.
This PIREP decodes as follows: Pilot Report, 64 nautical miles on the 63 degree radial from Oklahoma City VOR at 1522 UTC, flight level 8,000 feet. Type of aircraft is a Cessna 172. Outside air temperature is minus 4 degrees Celsius, wind is 245 degrees at 40 knots, light turbulence and the aircraft is in clear skies.
Most contractions in PIREP messages are self-explanatory. Icing and turbulence reports state intensities using standard terminology when possible. Intensity tables for turbulence and icing are in Section 14. If a pilot's description of an icing or turbulence encounter cannot readily be translated into standard terminology, the pilot's description is transmitted verbatim.
To lessen the chance of misinterpretation by others, report icing and turbulence in standard terminology. One PIREP stated, "...PRETTY ROUGH AT 6,500, SMOOTH AT 8,500 PA24..." A report of "light", "moderate" or "severe" turbulence at 6,500 feet would have been more understandable.
Pilot Reports of individual cloud layers, bases and tops should be reported in standard contractions. The height of a cloud base will precede the sky cover symbol and height of the cloud top will follow the symbol. For example, 038 BKN 070 means the base of a broken layer is at 3,800 feet and the top is at 7,000 feet (MSL).
Outside air temperature, in degrees Celsius, is given in 2 digits. If the temperature is below zero, the value will be preceded by a hyphen (-). Wind is given as six digits with the first 3 digits being direction and the last 3 digits being speed in knots.
The following excerpts are examples of ways to read transmitted Pilot Weather Reports:
... /RM DURD OAOI 150 OI 080...
means" ...during descent on and off instruments from 15,000 feet; on instruments from 8,000 feet...
... FL100 ... /TA -02/WV 250015
means" ...at 10,000 feet, temperature -2 degrees C, wind 250 degrees at 15 knots..."
... FL060/TP C172/SK INTMTLY BL/TB MDT...
means" ...at 6,000 feet, Cessna 172, intermittently between layers; moderate turbulence..."
UA/OV ABQ/TM 1845..TIJERAS PASS CLOSED DUE TO FOG AND LOW CLDS. UNABLE VFR RTNG ABQ.
is self-explanatory. Information of this type is helpful to others planning VFR flight in the area.
UA/OV TOL/TM 2200/FL 310/TP B707/TB MDT CAT 350-390
means "...over Toledo at 2200 UTC and flight level 31,000, a Boeing 707 reported moderate clear air turbulence from 35,000 to 39,000 feet.
Pilot Reports of a non-meteorological nature sometimes help air traffic controllers. This "plain language" report stated:
"...3N PNS LRG FLOCK OF GOOSEY-LOOKING BIRDS HDG GNLY NORTH MAY BE SEAGULLS FORMATION, LOUSY COURSE, ERRATIC..."
Even though in humorous vein, this PIREP alerted pilots and controllers to a bird hazard.
A PIREP always helps someone and becomes part of the aviation weather
service. Pilots should report any observation that may be of concern to
other pilots.
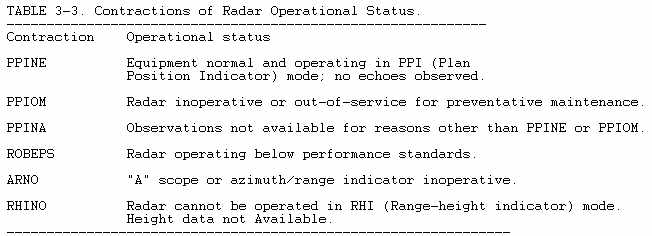
RADAR WEATHER REPORT (SP)
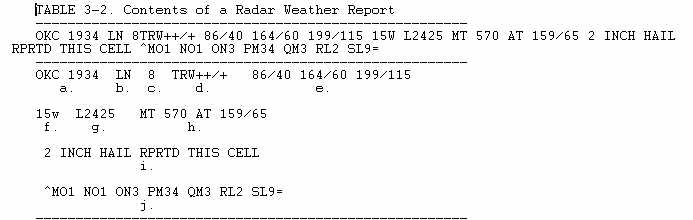
Thunderstorms and general areas of precipitation can be observed by radar. Most radar stations report each hour at H+35 with intervening special reports as required. The report includes the type, intensity, intensity trend and location of the precipitation. Also included is the echo top of the precipitation and if significant, the base echo. Note all heights are reported above Mean Sea Level (MSL). Table 3-1 explains symbols denoting intensity and trend. Table 3-2 shows the order and content of a Radar Weather Report.
See Table 7-1 for corresponding rainfall rates defining intensities. Note that intensity and intensity trend is not applicable to frozen precipitation.
Decoding a Radar Report (using above report as example):
a. Location identifier and time of radar observation (Oklahoma City Radar Weather Report at 1934 UTC in the example)
b. Echo pattern (line in this example) - the echo pattern or configuration may be a:
1. Line (LN) - a line of precipitation echoes at least 30 miles long, at least five times as long as it is wide and at least 30% coverage within the line.
2. Fine Line (FINE LN) - a unique clear air echo (usually precipitation free and cloud free) in the form of a thin or fine line on the PPI scope. It represents a strong temperature/moisture boundary such as an advancing dry cold front.
3. Area (AREA) - a group of echoes of similar type and not classified as a line.
4. Spiral Band Area (SPRL BAND AREA) - an area of precipitation associated with a hurricane that takes on a spiral band configuration around the center.
5. Single Cell (CELL) - a single isolated convective echo such as a rain shower.
6. Layer (LYR) - an elevated layer of stratiform precipitation not reaching the ground.
c. Coverage in tenths (8/10 in this example).
d. Type, intensity and intensity trend of weather (thunderstorm (T), very heavy rain showers (RW++) and increasing in intensity (/+) within the line in the example). See Table 7-1 for weather symbols used in a SD. See Table 3-1 for intensity and intensity trend symbols.
e. Azimuth, referenced to true north, and range, in nautical miles (NM), of points defining the echo pattern (86/40 164/60 199/115 in this echo)-See the examples that follow j. for elaboration of echo patterns.
f. Dimension of echo pattern (15 NM wide in this example) - The dimension of an echo pattern is given when azimuth and range define only the center line of the pattern. In this example, "15W" means the line has a total width of 15 NM, 7 1/2 miles either side of a center line drawn from the points given in example "e" above.
g. Pattern movement (line moving from 240 degrees at 25 knots in this example) - movement of individual storms or cells "C" and area movement "A" may also be indicated.
h. Maximum top and location (57,000 feet MSL on radial 159 degrees at 65 NM in this example).
i. Remarks - self-explanatory using plain language contractions.
j. Digital section - used for preparing Radar Summary Chart.
To aid in interpreting SDs, four examples are decoded into plain language.
FAR 1133 AREA 4TRW+/+ 22/100 88/170 196/180 220/115 C2425 MT 310 AT 162/110
Fargo, ND Radar Weather Observation at 1133 UTC. An area of echoes, four-tenths coverage, containing thunderstorms and heavy rain showers, increasing in intensity. Area is defined by points (referenced from FAR radar site) at 22 degrees, 100 NM; 88 degrees, 170 NM; 196 degrees, 180 NM and 220 degrees, 115 NM. These points, plotted on a map and connected with straight lines, outline the area of echoes. The thunderstorm cells are moving from 240 degrees at 25 knots. Maximum top (MT) is 31,000 feet MSL located at 162 degrees and 110 NM from FAR.
NPA 1935 SPL LN 10TRWX/NC 86/40 164/60 199/115 12W C2430 MT 440 AT 159/65 D10
Pensacola, FL Special Radar Weather Report at 1935 UTC. A line of echoes, ten-tenths coverage, thunderstorm, intense rain showers, no change in intensity.
The center of the line extends from 86 degrees, 40 NM; 164 degrees, 60 NM to 199 degrees, 115 NM. The line is 12 NM wide (12W). NOTE: To display graphically, plot the center points on a map and connect the points with a straight line; since the thunderstorm line is 12 miles wide, it extends 6 miles either side of your plotted line. The thunderstorm cells are moving from 240 degrees at 30 knots. The maximum top is 44,000 feet MSL at 159 degrees, 65 NM from NPA. The diameter of this thunderstorm is 10 NM.
MFR 1130 AREA 2S 27/80 90/125 196/50 268/100 A2410 MT U100
Medford, OR Radar Weather Report at 1130 UTC. An area, two-tenths coverage, of snow (no intensities or trend is assigned for non-liquid precipitation). The area is bounded by points 27 degrees, 80 NM; 90 degrees, 125 NM; 196 degrees, 50 NM and 268 degrees, 100 NM. Area movement is from 240 degrees at 10 knots. Maximum tops are 10,000 feet MSL, tops are uniform (smooth). Note that these are precipitation tops and not cloud tops.
MAF 1132 AREA 2TRW++6R-/NC 67/130 308/45 105W C2240 MT 380 AT 66/54
Midland, TX Radar Weather Report at 1132 UTC. An area of echoes, total coverage eight-tenths, containing two-tenths coverage of thunderstorms with very heavy rainshowers and six-tenths coverage of light rain. No change in intensity. (This suggests that the thunderstorms are embedded in an area of light rain.). Although the pattern is an "area", only two points are given followed by "105W". This means the area lies 52 and 1/2 miles either side of the line defined by the two points ... 67 degrees, 130 NM and 308 degrees, 45 NM. When a Radar Weather Report is transmitted, but doesn't contain any encoded weather observation, a contraction is sent which indicates the operational status of the radar. For example,
OKC 1135 PPINE
means Oklahoma City, OK's radar at 1135 UTC detects no echoes.
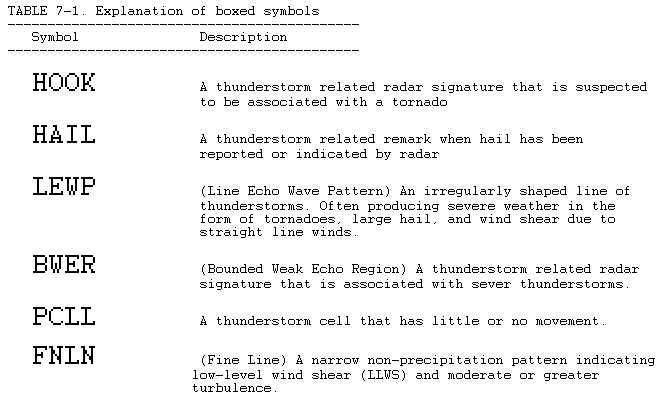
A Radar Weather Report may contain remarks in addition to the coded observation. Certain types of severe storms may produce distinctive patterns on the radar scope. For example, a "hook-shaped echo" may be associated with a tornado. A "line echo wave pattern" (LEWP) in which one portion of a squall line bulges out ahead of the rest of the line may produce strong gusty winds at the bulge. A "vault" on the Range Height Indicator scope may be associated with a severe thunderstorm that is producing large hail and strong gusty winds at the surface. If hail, strong winds, tornado activity, or other adverse weather is known to be associated with identified echoes on the radar scope, the location and type of phenomenon are included as a remark. Examples of remarks are "HAIL REPORTED THIS CELL,- "TORNADO ON GROUND AT 338/15" AND "HOOK ECHO 243/18". As far as indicating precipitation not reaching the ground, two commonly used contractions are "MALF and "PALF". These two contractions mean that the precipitation is "mostly aloft" and "partly aloft," respectively. That is, most or some of the precipitation is not reaching the ground. Bases of the precipitation will be reported in hundreds of feet MSL. For example, "PALF BASE 040" means part of the precipitation detected is evaporating at 4,000 feet MSL.
Radar Weather Reports also contain groups of digits. For example,
^MO1 NO1 ON3 PM34 QM3 RL2 SL9=
These groups of digits are the final entry on the SD.
This digitized radar information is used primarily by meteorologists and hydrologists for estimating amount of rainfall and in preparing the Radar Summary Chart. However, this code is useful in determining more precisely where the precipitation is occurring within an area and the intensity of the precipitation by using a proper grid overlay chart for the corresponding radar site. See Figure 3-3 for an example of a digital code plotted from the Oklahoma City, OK, SD.
The digit assigned to a box represents encoded intensity levels of the precipitation as determined by a video integrator processor VIP. See Table 7-2 for definitions of intensity levels 1 through 6. Thus, the term VIP LEVEL 1 simply means the precipitation intensity is weak or light, VIP LEVEL 2 is moderate, etc. Note that the maximum VIP LEVEL is encoded for any given box on the grid identified in the digital code.
A box is identified by two letters, the first representing the row in which the box is found and the second letter representing the column. For example "MO1" identifies the box located in row M and column O as containing precipitation with a maximum VIP LEVEL of one (1). A code of "MO1234" indicates precipitation in four consecutive boxes in the same row. Working from left to right box MO = 1, box MP = 2, MQ = 3 and box MR = 4.
When using hourly and Special Radar Weather Reports in preflight planning, note the location and coverage of echoes, the type, of weather reported, the intensity trend and especially the direction of movement.
A WORD OF CAUTION - remember that when the National Weather Service radar detects objects in the atmosphere it only detects those of precipitation size or larger. It is not designed to detect ceilings and restrictions to visibility. An area may be blanketed with fog or low stratus but unless precipitation is also present, the radar scope will be clear of echoes. Pilots should use Radar Reports along with SDs, SAO Reports and Forecasts when planning a flight.
Radar Weather Reports help pilots to plan ahead to avoid thunderstorm areas. Once airborne, however, they must depend on visual sighting or airborne radar to evade individual storms.
Another product provided for the use of the pilot in flight planning is an alphanumeric digital plot (Figure 3-2). The digital plot may be obtained through the request/reply circuit. The chart has digitized intensities plotted over a section map of several states. The numbers on the plot refer to "radar" intensity and represent the strongest return found in the area. From this plot the briefer/pilot may obtain the location of the strongest "radar" returns in the area of interest. Figure 3-2 shows the plotted intensities for the area of south Texas. The dots represent the state outline.
FIGURE 3-2. Digital Plot of Echo Intensities for the South Central U.S. Note: See Table 7-1 for Intensity Level Codes 1-6.
M = Missing
8 = Echoes of unknown intensity but believed to be severe.
9 = Echoes of unknown intensity but not believed to be severe.
NOTE: Echoes encoded as 8 or 9 are beyond 125 NM.
SATELLITE WEATHER PICTURES
Prior to weather satellites, weather observations were made only at distinct points within the atmosphere and supplemented by pilot observations (PIREPs). These PIREPs gave a "sense" of weather as viewed from above. However, with the advent of weather satellites, a whole new dimension to weather observing and reporting has emerged. There are two types of weather satellites in use today: GOES (a geostationary satellite) and NOAA (a polar orbiter satellite).
Two U.S. GOES satellites are used for imaging. One is stationed over the equator at 75 degrees west latitude and is referred to as GOES EAST since it covers the eastern U.S. The other is positioned at 135 degrees west latitude and is referred to as GOES WEST since it covers the western U.S. Together they cover North and South America and surrounding waters. They normally transmit an image of the earth, pole to pole, each half hour. When disastrous weather threatens the U.S., the satellites can scan small areas rapidly so that a picture can be received as often as every three minutes. Data from these rapid scans are used at national warning centers.
However, since the GOES satellite is stationary over the equator, the images poleward of about 50 degrees latitude become greatly distorted. For images above 50 degrees latitude, polar orbiting satellites are employed. The NOAA satellite is a polar orbiter and orbits the earth on a track which nearly crosses the North and South poles. A high resolution picture is produced about 500 miles either side of its track on the journey from pole to pole. The NOAA pictures are essential to weather personnel in Alaska and Canada.
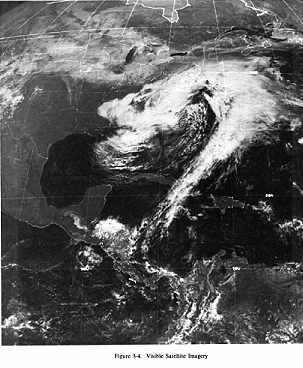
Basically, two types of imagery are available, and when combined, give a great deal of information about clouds. Through interpretation, the analyst can determine, the type of cloud, the temperature of cloud tops (from this the approximate height of the cloud can be determined) and the thickness of cloud layers. From this information, the analyst gets a good idea of the associated weather.
One type of imagery is visible imagery (Figure 3-4). With a visible picture, we are looking at clouds and the earth reflecting sunlight to the satellite sensor. The greater the reflected sunlight reaching the sensor, the whiter the object is on the picture. The amount of reflectivity reaching the sensor depends upon the height, thickness, and ability of the object to reflect sunlight. Since clouds are much more reflective than most of the earth, clouds will usually show up white on the picture, especially thick clouds. Thus, the visible picture is primarily used to determine 1) the presence of clouds and 2) the type of cloud from shape and texture. Due to the obvious lack of sunlight, there are no visible pictures available from the GOES satellite at night.
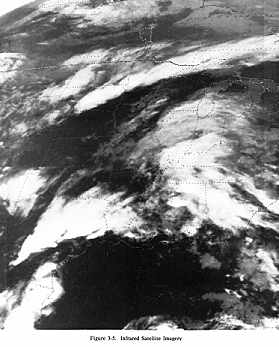
The second type of imagery is infra-red (IR) imagery (Figure 3-5). With an IR picture we are looking at heat radiation being emitted by the clouds and earth. The images show temperature differences between cloud tops and the ground, as well as, temperature gradations of cloud tops and along the earth's surface. Ordinarily, cold temperatures are displayed as light gray or white. High clouds appear the whitest. However, various computer-generated enhancements are sometimes used to sharply illustrate important temperature changes. IR images are used to determine cloud top temperatures which can approximate the height of the cloud. From this, one can see the importance of using visible and IR imagery together when interpreting clouds. IR images are available both day and night. Operationally, images are received once every 30 minutes. The development and dissipation of weather can be seen and followed over the entire country and coastal regions from imagery use.
NOTE: At the time of this revision, GOES East (75 degrees west longitude) has become inoperative and GOES West is the only U.S. satellite providing geosynchronous imagery of the U.S. During the summer and fall it is positioned so as to provide coverage of the eastern U.S. during the time the tropical weather season is most active. During the winter and spring, GOES West is re-positioned further west to provide coverage of the winter Pacific storms moving onshore on the west coast. This moving from one position to another provides less than optimal coverage of portions of the U.S. during different seasons of the year, but is necessary in order to cover as much of the U.S. as possible. In addition to satellite information from NOAA polar orbiters, the Europeans have loaned a geostationary satellite located at 50 degrees west (expected to be moved to 75 degrees west in early 1994).
The next generation of U.S. GOES satellites will be sent aloft in the mid 1990s.
FIGURE 3-3. Digital Radar Report Plotted on a PPI Grid Overlay Chart. Data from Table 3-2.
Note: See Table 7-1 for Intensity Level Codes 1 through 6.
The following VIP LEVEL codes are used for echoes beyond 125 nautical miles:
8 = Echoes of unknown intensity but believed to be severe from other reports.
9 = Echoes of unknown intensity but not believed to be severe.
FIGURE 3-4. Visible Satellite Imagery.
FIGURE 3-5. Infrared Satellite Imagery