SURFACE ANALYSIS CHART
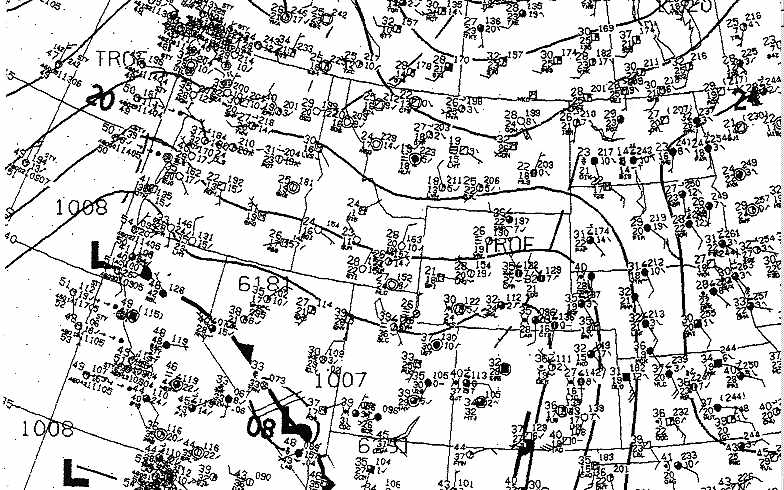
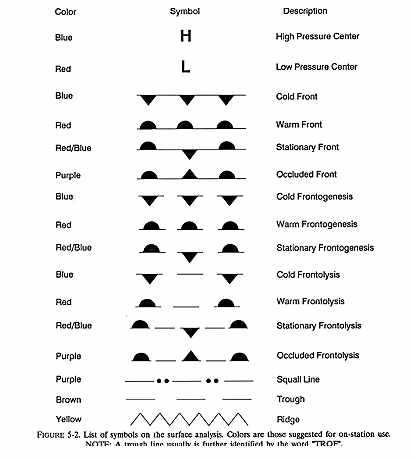
A surface analysis is commonly referred to as a surface weather analysis chart. The surface analysis chart is a computer-prepared chart that covers the contiguous 48 states and adjacent areas. The chart is transmitted every three hours. Figure 5-1 is a section of a surface weather chart and Figure 5-2 illustrates the symbols depicting fronts and pressure centers.
VALID TIME
Valid time of the chart corresponds to the time of the plotted observations. A date-time group in Universal Coordinated Time (UTC) tells the user when conditions portrayed on the chart were occurring.
ISOBARS
Isobars are solid lines depicting the sea level pressure pattern and are usually spaced at intervals of 4 millibar (mb), or hectoPascals (hPa) in metric units (1 millibar = 1 hectoPascal). When the pressure gradient is weak, dashed isobars are sometimes inserted at 2 mb/hPa intervals to more clearly define the pressure pattern. Each isobar is labelled by a two-digit number. For example, 32 signifies 1032.0 mb/hPa, 00 signifies 1000.0 mb/hPa, and 92 signifies 992.0 mb/hPa.
PRESSURE SYSTEMS
The letter "L" denotes a low pressure center and the letter "H" denotes a high pressure center. The pressure of each center is indicated by a three or four digit number which is the central pressure in millibars.
FRONTS
The analysis shows frontal positions and types of fronts by the symbols in Figure 5-2. The "pips" on the front indicated the type of front and point in the direction toward which the front is moving. Pips on both sides of a front indicate a stationary front (little or no movement). Briefing offices sometimes color the symbols to facilitate use of the map.
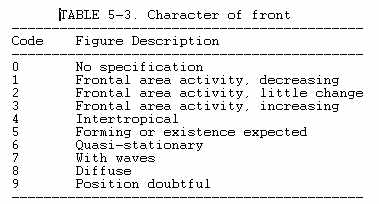
A three-digit number near a front classifies it as to type, Table 5-1; intensity, Table 5-2; and character, Table 5-3. A bracket ( [ or ] ) before or after the number "points" to the front the number refers to. For example, in Figure 5-1, the front extending from central Georgia across the Gulf of Mexico to south Texas is labeled "457." This means a cold front ("4" from Table 5-1), moderate with little or no change ("5" in Table 5-2) and with waves along the front ("7" in Table 5-3).
The waves along the front may be weak, low pressure centers which either are not indicated or are simply one part of the front moving faster than the other. The triangular pips also identify this front as a cold front. The pips point southeast indicating the cold front is moving to the southeast.
Two short lines across a front indicate a change in classification. In Figure 5-1 note that two lines cross the front in western Arizona. The front changes from "420" to "629". In this case the cold front from the Pacific into western Arizona changes to an occluded front in southern Nevada.
TROUGH AND RIDGES
A trough of low pressure with significant weather will be depicted as a thick, dashed line running through the center of the trough and identified with the word "TROF". The symbol for a ridge of high pressure is very rarely, if at all, depicted (Figure 5-2).
OTHER INFORMATION
The observations from a number of stations are plotted on the chart to aid in analyzing and interpreting the surface weather features. These plotted observations are referred to as station models.
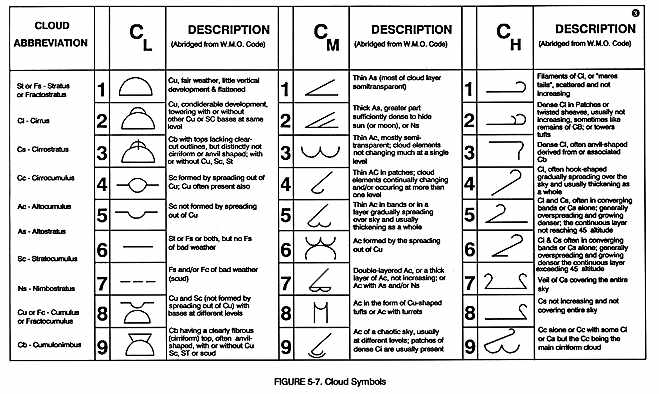
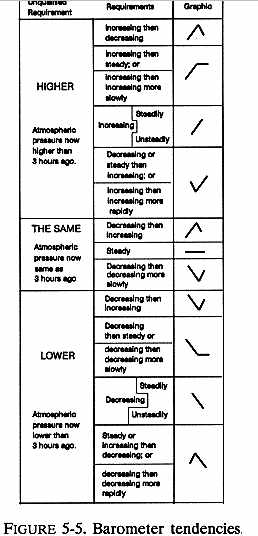
There are two primary types of station models plotted on the chart. Those with a round station symbol are observations from locations where the observations are taken by observers. The locations with a square station symbol are observations from automated sites. Other plotting models which appear over water on the chart are data from ships, buoys, and offshore oil platforms. Figure 5-3 is an example of a station model which shows where the weather information is plotted. Figure 5-4 through Figure 5-7 {5-5, 5-6} help explain the decoding of the station model.
A legend is printed on each chart stating that it is the Surface Analysis, the date and time of the chart, with additional information regarding the automated observations sites and a volcanic ash symbol.
USING THE CHART
The surface analysis chart provides a ready means of locating pressure
systems and fronts. It also gives an overview of winds, temperatures and
dew point temperatures at chart time. When using the chart, keep in mind
that weather moves and conditions change. Using the surface analysis chart
in conjunction with other information gives a more complete weather picture.