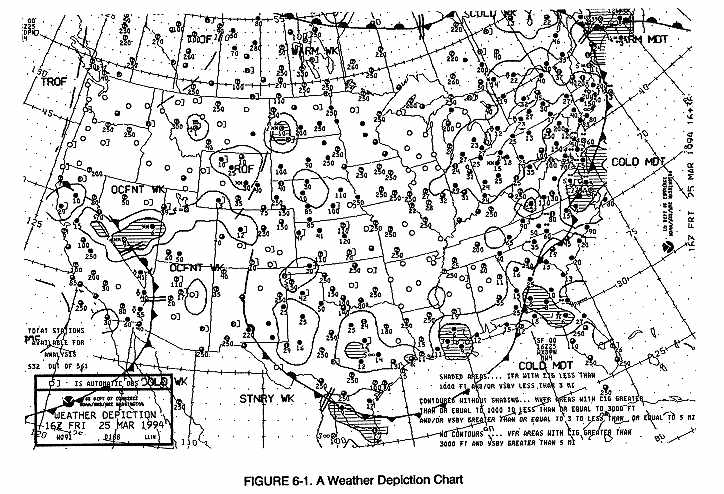
WEATHER DEPICTION CHART
The weather depiction chart, Figure 6-1, is computer-prepared from Surface Aviation Observations (SAO). The weather depiction chart gives a broad overview of the observed flying category conditions at the valid time of the chart. This chart begins at 01Z each day, is transmitted at three hour intervals, and is valid at the time of the plotted data.
PLOTTED DATA
Data for the chart comes from the observations reported by both manual and automated observation locations. The automated stations are denoted by a bracket ( ] ) plotted to the right of the station circle. The plotted data for each station are:
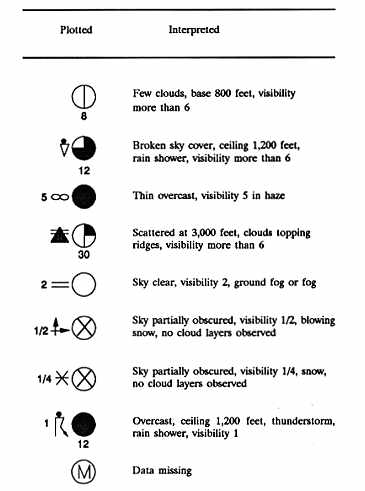
Total Sky Cover
The amount of sky cover is shown by the station circle shaded as in Table 6-1.
Cloud Height or Ceiling
Cloud height above ground level is entered under the station circle in hundreds of feet, the same as coded in a SAO report. If total sky cover is scattered, the cloud height entered is the base of the lowest layer. If total sky cover is broken or greater, the cloud height entered is the ceiling. Broken or greater total sky cover without a height entry indicates thin sky cover. A partially or totally obscured sky is shown by the same sky cover symbol "X". However, a partially obscured sky without a cloud layer above is denoted by the absence of a height entry. A partially obscured sky with clouds above will have a cloud layer or ceiling height entry. A totally obscured sky always has a height entry of the ceiling (vertical visibility into the obscuration).
Weather and Obstructions to Vision
Weather and obstructions to vision symbols are entered to the left of the station circle. Figure 5-6 explains most of the symbols used. When an SAO reports clouds topping ridges, a symbol unique to the weather depiction chart is entered to the left of the station circle:
When several types of weather and/or obstructions to visibility are reported at a station, only the most significant one is entered (i.e. the highest coded number in Figure 5-6).
Visibility
When visibility is 6 miles or less, it is entered to the left of the weather or obstructions to vision symbol. Visibility is entered in statute miles and fractions of a mile. Table 6-2 shows examples of plotted data.
ANALYSIS
The chart shows observed ceiling and visibility by categories as follow:
1. IFR - Ceiling less than 1,000 feet and/or visibility less than 3 miles; hatched area outlined by a smooth line.
2. MVFR (Marginal VFR) - Ceiling 1,000 to 3,000 feet inclusive and/or visibility 3 to 5 miles inclusive; non-hatched area outlined by a smooth line.
3. VFR - No ceiling or ceiling greater than 3,000 feet and visibility greater than 5 miles; not outlined.
The three categories are also explained in the lower right portion of the chart for quick reference.
Referring to Figure 6-1, the MVFR conditions in eastern Tennessee and southeast Arkansas/northwest Mississippi are indicated in areas where nearby plotted stations show only VFR conditions. Note that off the Baja California coast, it is stated that the total stations analyzed for this chart are far more numerous than the number of stations actually plotted. Therefore, there are stations in eastern Tennessee and southeast Arkansas/northwest Mississippi that are not plotted on the chart, but are reporting MVFR conditions.
In addition, the chart shows fronts and troughs from the surface analysis for the preceding hour. These features are depicted the same as the surface chart.
USING THE CHART
The weather depiction chart is an ideal place to begin preparing for a weather briefing and flight planning. From this chart, one can get a "birds eye" view of areas of favorable and adverse weather conditions for chart time.
This chart may not completely represent the en route conditions because of variations in terrain and possible weather occurring between reporting stations. Due to the delay between data and transmission time, changes in the weather could occur. One should update the chart with current SAO reports. After initially sizing up the general weather picture, final flight planning must consider forecasts, progs and the latest pilot, radar, and surface weather reports.