RADAR SUMMARY CHART
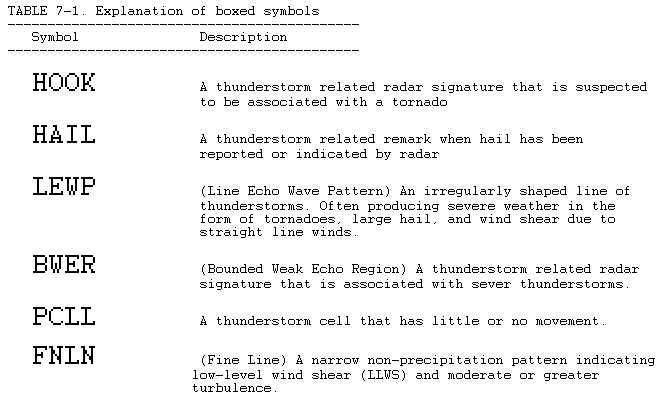
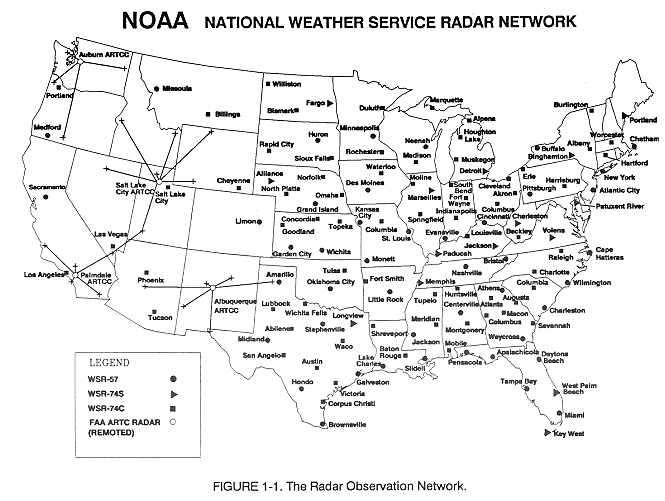
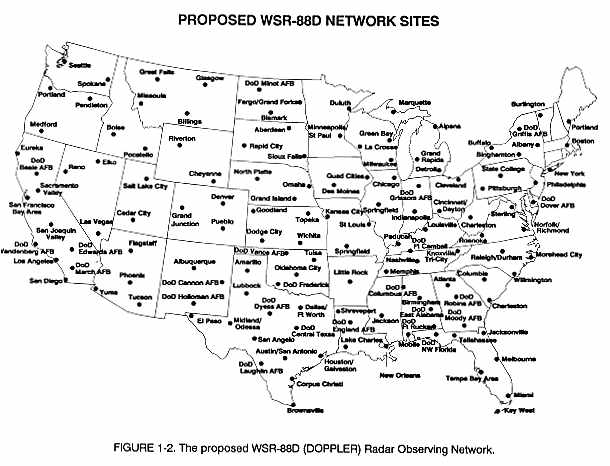
A radar summary chart, Figure 7-1, graphically displays a collection of radar weather reports (SDs). Figures 1-1 and 1-2 depict the National Weather Service radar network. This computer-generated chart is constructed from regularly scheduled radar observations and is valid at the time of the reports (H+35), i.e., 35 minutes past each hour. These charts are available between 16 and 24 hours daily depending on the system being used. The chart displays the type of precipitation echoes, their intensity, intensity trend, configuration, coverage, echo tops and bases, and movement. Severe weather watches are plotted if they are in effect when the chart is valid.
ECHO TYPE
Radar primarily detects particles of precipitation size within a cloud or falling from a cloud. The type of precipitation can be determined by the radar operator from the scope presentation in combination with other sources. Table 7-2 lists the symbols used to denote types of precipitation.
INTENSITY AND INTENSITY TREND
The intensity is obtained from the Video Integrator Processor (VIP) and is indicated on the chart by contours. The six VIP levels are combined into three contours as indicated in Table 7-2. In Figure 7-1 over southwest Nebraska and northwest Kansas, there is an area of precipitation depicted by one contour. The area would have an intensity of VIP level 1 and possibly VIP level 2. Whether there is a VIP level 2 in the area cannot be determined. However, what can be said is that the maximum intensity is definitely below VIP level 3. When determining intensity levels from this chart, it is recommended that the maximum possible intensity be used. To determine the actual maximum VIP level, the radar weather report (SD) for that time period should be examined.
The intensity trend is indicated by a symbol plotted beside the precipitation type. Looking at Figure 7-1, the rain showers in Virginia (RW-) have decreased in intensity since the last observation. The absence of a trend symbol indicates no change. The area of light to moderate rain (R) and rain showers (RW) over Tennessee and Kentucky, have not changed in intensity from the previous observation. The rain showers in southern California (RW+) have increased in intensity since the last observation.
The actual intensity for frozen precipitation cannot be determined from the contours as the intensity levels are only correlated to liquid precipitation. Intensity trend for frozen precipitation is neither reported on a SD nor the radar summary chart. The "SW+" for the precipitation area in Colorado means the area of snow showers is new, i.e. it was not reported on the last observation. A "S" on the chart means an area of snow is indicated by radar with no reference to intensity trend. Remember the intensity trend symbols; (-) decreasing, (no symbol) no change, and (+) increasing refer to liquid precipitation only.
It is important to remember that intensity on the radar summary chart is shown by contours and not by the symbol following the type of precipitation.
ECHO CONFIGURATION AND COVERAGE
The configuration is the arrangement of echoes. There are three designated arrangements; a LINE of echoes, an AREA of echoes, and an isolated CELL. See Section 3 under radar reports for definitions of the three configurations.
Coverage is simply the area covered by echoes. All of the hatched area inside of the contours on the chart is considered to be covered by echoes. When the echoes are reported as a LINE, a line will be drawn through them on the chart. Where there is 8/10 coverage or more, the line is labeled as solid (SLD) at both ends. In the absence of this label it can be assumed that there is less than 8/10 coverage. For example in Figure 7-1, there is a solid line of thunderstorms with intense to extreme rain showers along the coast of the Florida panhandle.
ECHO HEIGHTS
Echo heights in locations with radars designed for weather detection are obtained by use of range height indicators and are PRECIPITATION tops and bases. In those areas not served by National Weather Service radars, the tops are obtained from pilot reports and are actual CLOUD tops. Usually, echo height will be missing in the western mountain regions because ARTCC radars are used.
Heights are displayed in hundreds of feet MSL and should be considered
only as approximations because of radar limitations. Tops are entered above
a short line while any available bases are entered below. The top height
displayed is the highest in the indicated area.
For example:
220 Bases 8,000 feet, Maximum top 22,000 feet
080
500 Bases at surface, Maximum top 50,000 feet
020 Bases 2,000 feet, Maximum top either missing or reported in another place
Absence of a figure below the line indicates that the echo base is at or near the surface. Radar detects tops more readily than bases because precipitation usually reaches the ground. For example, over Kentucky and Tennessee, (see Figure 7-1), the maximum precipitation top in the area is 15,000 to 17,000 feet MSL. The location is indicated by a line drawn from the top value to the location of that top. Further west, the area of snow over Nebraska and Kansas has a base of 7,000 feet MSL and a top of 18,000 feet MSL.
ECHO MOVEMENT
Individual cell movement is indicated by an arrow with the speed in knots entered as a number at the top of the arrow head. Little movement is identified by "LM." Line or area movement is indicated by a shaft and barb combination with the shaft indicating the direction and the barbs the speed. A half barb is 5 knots, a whole barb is 10 knots, and a pennant is 50 knots.
For example, in Figure 7-1, for the area of snow and rain over central California, no cell movement is given, but the area movement is toward the west at 15 knots. Over southern California, no area movement is given, but the cell movement of the rain showers is toward the east at 20 knots.
SEVERE WEATHER WATCH AREAS
Severe weather watch areas are outlined by heavy dashed lines, usually in the form of a large rectangular box. There are two types, tornado watches and severe thunderstorm watches. Referring to Figure 7-1 and Table 7-2, the type of watch and the watch number are enclosed in a small rectangle and positioned as closely as possible to the northeast corner of the watch box. For example, in Figure 7-1, the boxed "WS036" in South Carolina means the watch area in the southeastern U.S. is a severe thunderstorm watch and is the 36th severe weather watch issued so far in the year. The watch number is also printed at the bottom of the chart (in Mexico) together with the issuance time and valid until time.
CANADIAN DATA
Radar data from Canadian radar stations are plotted when available. The stations are Halifax, Holyrood, Mechanics Settlement, Broadview, Elbow, Vivian, Mont Apica, Britt, Carp, Exeter, Montreal, River Harbour, Upsala, Villerpy, King City, Carvel, Vulcan, Cold Lake and McGill. The data is displayed in AZRAN (azimuth-range) format with echo areas outlined by solid lines. Area, line and cell movements are shown in the same manner as U.S. data. An alphanumeric code associated with each echo shows, in order, area coverage, precipitation type, intensity, and intensity trend. Precipitation type and intensity trend are the same as U.S. data. For area coverage, a blank designator represents cells, a 1 equals less than 1/10 coverage, a 4 equals 1/10 to 5/10 coverage, a 7 equals 6/10 to 9/10 coverage, and 10 equals 10/10 coverage. For intensity levels, 0 is very weak, 1 is weak, 2 is moderate, 3 is strong and 4 is very strong. Levels 1 through 4 are comparable to the U.S. VIP levels of 1 through 4.
Canadian echo top reports are converted from meters to feet and are plotted to the nearest hundreds of feet MSL For example, 197 is 19,700 feet MSL.
It is sometimes difficult to interpret the data when both U.S. and Canadian reports are plotted. Do not confuse a Canadian report with a severe weather watch box. The Canadian radar reports are enclosed by a solid line box, while a severe weather watch box is outlined by a dashed line.
USING THE CHART
The radar summary chart aids in preflight planning by identifying general areas and movement of precipitation and/or thunderstorms. Radar detects ONLY drops or ice particles of precipitation size, it DOES NOT detect clouds and fog. Therefore, the absence of echoes does not guarantee clear weather, and cloud tops may be higher than the tops detected by radar. The chart must be used in conjunction with other charts, reports, and forecasts.
Examine chart notations carefully. Always determine location and movement of echoes. If echoes are anticipated near the planned route, take special note of echo intensity and trend. Be sure to examine the chart for missing radar reports before assuming "no echoes present". For example, the Garden City (GCK) radar report in southwest Kansas is shown as not available (NA). There could be echoes in southwest Kansas but be too far away to be detected by the other surrounding radars.
Suppose the planned flight route goes through an area of widely scattered thunderstorms in which no increase is anticipated. If these storms are separated by good VFR weather, they can be visually sighted and circumnavigated. However, widespread cloudiness may conceal the thunderstorms. To avoid these embedded thunderstorms, either using airborne radar or detouring the area would be necessary. Details on avoiding hazards of thunderstorms are given in Chapter 11, Aviation Weather.
Remember that the radar summary chart is for preflight planning only and should be updated by hourly radar reports. Once airborne, the pilot must evade individual storms by inflight observations either by visual sighting, using airborne radar, or by requesting radar echo information from FSS Flight Watch. FSS Flight Watch has access to Radar Remote Weather Displays (RRWDS).
There can be an interpretation problem concerning an area of precipitation
that is reported by more than one radar site. For example, station A may
report RW- with cell movement toward the northeast at 10 knots. For the
same area, station B may be reporting TRW+ with cell movement toward the
northeast at 30 knots. This difference in reports may be due to a different
perspective and distance of the radar site from the area of echoes. The
area may be moving away from station A and approaching station B. The rule
of thumb is to use that plotted data associated with the area which presents
the greatest hazard to aviation. In this case, the station B report would
be the used.