SIGNIFICANT WEATHER PROGNOSTIC CHARTS
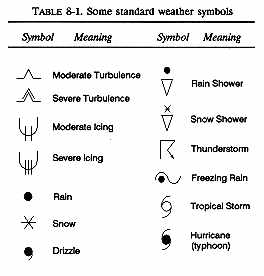
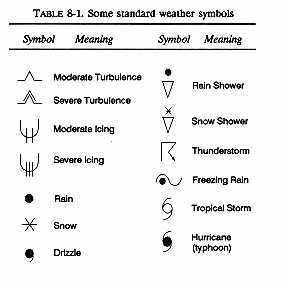
Significant weather prognostic charts, called "progs" for brevity, portray forecast weather which may influence flight planning. Table 8-1 explains some symbols used on these charts. Significant weather progs are issued both for domestic and international flights.
TABLE 8-1. Some standard weather symbols
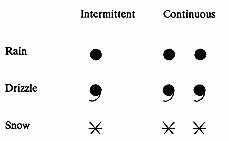
NOTE: Character of stable precipitation is the manner in which it occurs. It may be intermittent or continuous. A single symbol denotes intermittent and a pair of symbols denotes continuous.
Examples,
|
Significant weather progs are both manually and computer-prepared for the conterminous U.S. and adjacent areas. The U.S. low-level significant weather prog is designed for domestic flight planning to 24,000 feet MSL and a U.S. high-level prog is for domestic flights from 24,000 feet to 63,000 feet MSL Chart legends include valid time in UTC.
U.S. LOW-LEVEL SIGNIFICANT WEATHER PROG
The low-level prog is a four-panel chart as shown in Figure 8-1. The two lower panels are 12- and 24-hour surface progs. The two upper panels are 12- and 24-hour progs of significant weather from the surface to 400 millibars/hectoPascals (24,000 feet MSL). The charts show conditions as they are forecast to be at the valid time of the chart. This chart is issued four times daily with the 12- and 24-hour forecasts based on the 00Z, 06Z, 12Z and 18Z synoptic data. For example, the prog in Figure 8-1 is based on the 12Z, 25 MAR 1994 initial data.
Surface Prog. The two surface prog panels use standard symbols for fronts, significant troughs, and pressure centers explained in section 5. High and Low pressure centers are indicated by a two digit number. These two-digit numbers are underlined on the manually prepared chart, but not on the computer prepared chart. Isobars depicting forecast pressure patterns are included on some 24 hour surface progs.
The surface prog also outlines areas of forecast precipitation and/or thunderstorms as shown in the lower panels of Figure 8-1. Solid lines enclose areas of expected continuous or intermittent (stable) precipitation and dash-dot lines enclose areas of showers and thunderstorms (unstable precipitation). Areas of continuous or intermittent precipitation with embedded showers and thunderstorms are also enclosed by solid lines.
Note that the symbols indicate precipitation type and character (Table 8-1 and 8-2). If precipitation affects half or more of an area, that area is shaded. The absence of shading denotes more sparse precipitation, specifically less than half the area coverage. Look at the lower left panel of Figure 8-1. At 00Z, the forecast is for rain showers and thunderstorms covering more than half of the area of southern Arkansas and portions of Tennessee, Mississippi, and Alabama. Elsewhere over much of the southeastern U.S., rain showers and thunderstorms covering less than half the area are expected. In the area of precipitation over California, Nevada, and Utah, the dashed line through central California represents the rain/snow line.
Significant Weather. The upper panels of Figure 8-1 depicts IFR, MVFR, turbulence, and freezing levels. Note that the legend near the center of the chart explains the methods of depiction.
Smooth lines enclose areas of forecast IFR weather and scalloped lines enclose areas of marginal weather (MVFR). VFR areas are not outlined. This is not the same manner of depiction used on the Weather Depiction Chart to portray IFR and MVFR. Referring to Figure 8-1, at 00Z, an area of IFR conditions is depicted portions of Arkansas, Tennessee, Mississippi, and Alabama and is surrounded by an area of MVFR. Notice that the depiction does not extend over the Gulf even though IFR conditions may exist there.
Other areas of MVFR conditions are forecast over the western U.S. and MVFR and IFR conditions are forecast from the Great Lakes region across Canada into the New England area.
Forecast areas of non-convective turbulence of moderate or greater intensity are enclosed by long, dashed lines. Since thunderstorms always imply moderate or greater turbulence, areas of thunderstorm related turbulence will not be outlined.
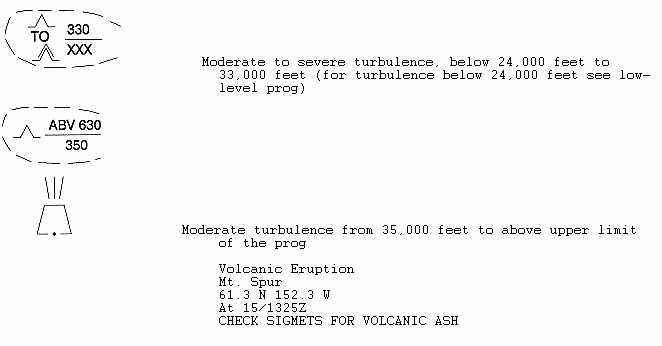
A symbol entered within a general area of forecast turbulence denotes intensity. Numbers below and/or above a short line show expected base and/or top of the turbulent layer in hundreds of feet MSL Absence of a number below the line indicates turbulence from the surface upward. No number above the line indicates turbulence extending above the upper limit of the chart. Turbulence forecast from the surface to above 24,000 feet MSL is denoted by the notation "SFC" below the line and no entry above the line. Referring to Figure 8-1, at 00Z, an area of moderate non-thunderstorm related turbulence is forecast from the surface to 14,000 feet MSL over most of California and stretching eastward across Arizona, into Colorado and New Mexico. Within this area, a smaller area of moderate to severe turbulence is expected from the surface to 24,000 feet MSL along and near the central and southern California coastline. Other areas of non-thunderstorm related turbulence are forecast over the southeastern and northeastern U.S. Thunderstorm related turbulence is indicated on the lower panels by the forecast areas of thunderstorms.
Freezing level height contours for the highest freezing level are drawn at 4,000-foot intervals. The 4,000-foot contour terminates at the 4,000-foot terrain level along the Rocky Mountains. Contours are labeled in hundreds of feet MSL The zig-zag line where the freezing level is forecast to be at the surface and is labeled "SFC." An upper freezing level contour crossing the surface/32 degree line indicates multiple freezing levels. Multiple freezing levels indicate layers of warmer air aloft. If clouds and precipitation are forecast in this area, icing hazards should be considered.
The low-level significant weather prog does not specifically outline areas of icing. However, icing is implied in clouds and precipitation above the freezing level. Interpolate for freezing levels between the given contours. For example, in Figure 8-1 at 00Z, the forecast highest freezing level over St. Louis is approximately 6,000 feet MSL.
36- and 48-Hour Surface Weather Prog
This prog is an extension of the 12- and 24-hour surface prog and is based on the 00Z and 12Z initial synoptic data. The prog in Figure 8-2 is a continuation of the 12- and 24-hour prog in Figure 8-1.
The depiction of data is about the same as the 12- and 24-hour surface
prog with the following exceptions.
1. Freezing precipitation is not forecast.
2. Scalloped lines denote areas of overcast clouds with no reference
to the height of the cloud base.
3. A prognostic discussion is included to explain the forecaster's
reasoning for the 12- through 48-hour surface progs.
Use of the Chart
The 36- and 48-hour surface prog should only be used for outlook purposes. That is, just to get a very general picture of the weather conditions that are in the relatively distant future.
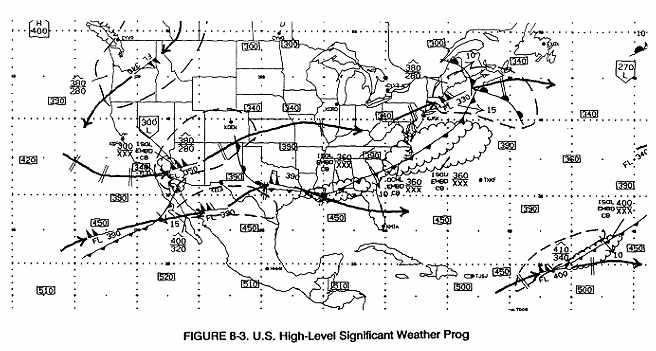
HIGH LEVEL SIGNIFICANT WEATHER PROG
The High-Level Significant Weather Prog is derived from forecasts for both domestic and international flights. The U.S. National Meteorological Center (NMC), near Washington D.C., is a component of the World Area Forecast System (WAFS). NMC is designated in the WAFS as both a World Area Forecast Center and a Regional Area Forecast Center (RAFC). The main function of the NMC as a WAFS, is to prepare global forecasts in grid-point form of upper winds and upper air temperatures and to supply the forecasts to associated RAFCs. An important RAFC function is to supply users with forecast winds and temperatures aloft along with significant weather forecast charts.
The High-Level Significant Weather Prog, Figure 8-3, encompasses airspace from 25,000 feet to 60,000 feet pressure altitude over the conterminous U.S., Mexico, Central America, portions of South America, the western Atlantic, and eastern Pacific. This section discusses the content of high-level significant weather progs.
The following weather is depicted on the charts:
a. active thunderstorms
b. severe squall lines
c. tropical cyclone(s)
d. from 10,000 feet MSL to flight level 250, clouds associated with
a) thru c) above
e. above flight level 250, cumulonimbus cloud associated with a) to
c) above
f. moderate or severe turbulence (in cloud or clear air)
g. moderate or severe icing
h. widespread sandstorm/duststorm(s)
i. surface positions of well-defined convergence zones
j. surface positions, speed and direction of movement of frontal systems
k. tropopause heights
l. jetstreams
m. volcanic activity, including the name of the volcano, latitude and
longitude, the date and time of the first eruption, and a reminder to check
any SIGMETs for further information.
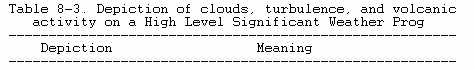
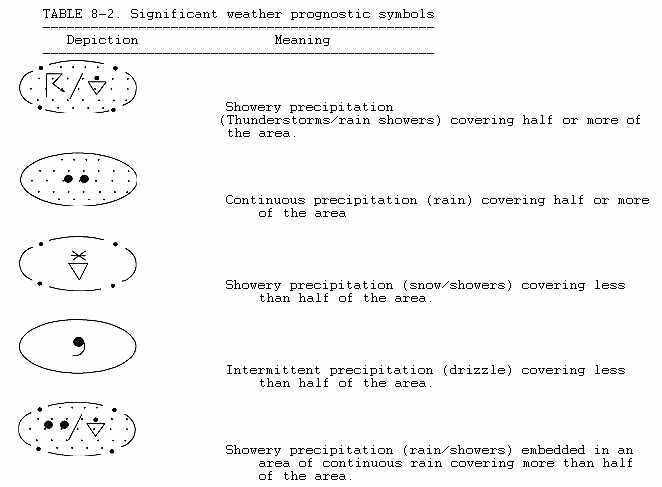
Table 8-3 gives some examples of notations appearing on a High Level Significant Weather Prog chart.
 |
|
 |
|
 |
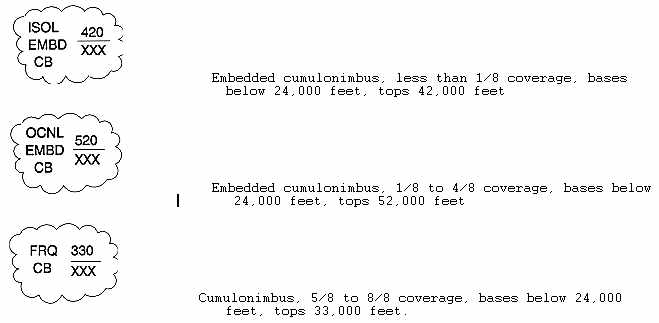
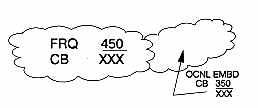
CB data will normally be identified as ISOL EMBD CB (isolated embedded CB), OCNL EMBD CB (occasional embedded CB), ISOL CB in HAZE (isolated CB in haze), or OCNL CB in HAZE (occasional CB in haze). In rare instances, CB coverage above FL240 may exceed 4/8 coverage; in these instances, CB activity will be described as FRQ CB (frequent cumulonimbus with little or no separation). The meanings of these area coverage terms are: ISOL (less than 1/8), OCNL (1/8 to 4/8) and FRQ (5/8 to 8/8).
CB bases below FL240 are shown as XXX CB tops are expressed in hundreds of feet MSL The area the forecast applies to is enclosed by scalloped lines.
For example:
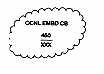 |
Occasional (1/8 to 4/8 area coverage) embedded cumulonimbus clouds with bases below FL240 and tops forecast to reach FL450. |
 |
Isolated (less than 1/8 area coverage) embedded cumulonimbus clouds with bases below FL240 and tops forecast to reach FL350. |
| Squall Lines - Severe squall lines are lines of CB's of 5/8's coverage or greater and pose a significant hazard to aviation. A squall line is depicted as shown below. | |
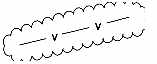 |
Severe squall lines are depicted within areas of CB activity by this symbol. |
| An example of a severe squall line and the associated CB area. |
 |
Tropical Storms - the symbol to the left depicts tropical storms. Areas of associated cumulonimbus activity, if meeting the previously given criteria (ISOL EMBD CB, OCNL EMBD CB, ISOL CB IN HAZE, OCNL CB IN HAZE, FRQ CB), are enclosed by scalloped lines and labeled with the vertical extent. |
1. The names of tropical cyclones, when relevant, are entered adjacent to the symbol.
2. A significant weather chart depicting the tropical cyclone symbol will state that the latest tropical cyclone advisory, rather than the tropical cyclone's forecast position on the chart, is to be given public dissemination.
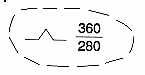
Turbulence - Areas of forecast moderate or greater clear air turbulence (CAT) are bounded by heavy, dashed lines. Clear air turbulence includes all turbulence (wind shear induced and mountain wave induced) not caused by convective activity. Areas are labeled with appropriate turbulence symbol (Table 8-1) and the vertical extent in hundreds of feet MSL.
For example:
 |
A thunderstorm area (5/8 to 8/8 area coverage, bases below FL240, tops FL500) associated with a tropical cyclone. |
| For example: | |
 |
An area forecast moderate CAT with vertical extent from FL280 to FL360. |
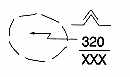 |
An area of forecast severe CAT with vertical extent from FL240 to FL320. |
Note: The symbol CB implies hail, moderate or greater turbulence, and icing.
Sand/Duststorms - Areas of widespread sandstorms (BN) and duststorms (BD) are enclosed by scalloped lines and labeled by symbol and vertical extent.
For example:
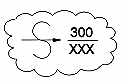 |
Widespread sandstorm or duststorm with bases below FL240 (at the surface) and tops forecast to reach FL300. |
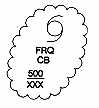
Convergence Zones - Convergence zones are areas of active thunderstorm activity. These zones are enclosed by scalloped lines and labeled with the vertical extent of the CBs. Note that the CBs must meet the previous given criteria (ISOL EMBD- CB, OCNL EMBD CB, ISOL CB IN HAZE OCNL CB IN HAZE, FRQ CB).
For example:
 |
The forecast position of the inter-tropical convergence zone is shown by the associated thunderstorm areas. The coverage for the frequent CBs is 5/8 to 8/8 with bases below FL240 with tops at FL450. The coverage for the occasional CBs is 1/8 to 4/8 with bases below FL240 and tops at FL350. |
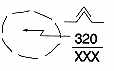
Fronts - The forecast surface positions, speed, and direction of movement of frontal systems associated with significant weather are also depicted.
For example:
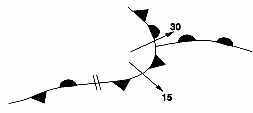 |
A frontal system is forecast to be at the position and with the orientation indicated at the valid time of the prognostic chart. The forecast movement related to true north and speed in knots are indicated by arrow shafts and adjacent numbers. |
 Tropopause Heights - Tropopause
heights are depicted in hundreds of feet MSL The five sided polygon, on
the left, indicates areas of high and low tropopause heights. This particular
example shows a low tropopause height of 22,000 feet MSL. Other heights
may be used occasionally to define areas of very flat tropopause slope.
Depicted heights are enclosed in small rectangular blocks. For example,
Figure 8-3 shows the tropopause sloping from 30,000
feet in North Dakota to 39,000 feet in Oklahoma.
Tropopause Heights - Tropopause
heights are depicted in hundreds of feet MSL The five sided polygon, on
the left, indicates areas of high and low tropopause heights. This particular
example shows a low tropopause height of 22,000 feet MSL. Other heights
may be used occasionally to define areas of very flat tropopause slope.
Depicted heights are enclosed in small rectangular blocks. For example,
Figure 8-3 shows the tropopause sloping from 30,000
feet in North Dakota to 39,000 feet in Oklahoma.
Jet Streams - The height and maximum wind speed of jet streams having a core speed of 80 knots or greater are shown. The height is given as a flight level (FL). The beginning of the line shows a core speed of 80 knots. A double, hatched line across the jet stream core indicates a speed increase or decrease. The double, hatched line indicates 20 knot changes at 100 knots, 120 knots, 140 knots or higher. The maximum core speed along the jet stream is depicted by shafts, pennants, and feathers.
For example:
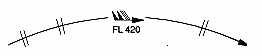
A jet stream with a forecast maximum speed of 130 knots at a height
of 42,000 feet MSL. The extreme left line starts at 80 knots. The first
hatched, double line indicates a speed increase of 20 knots to 100 knots
and the second double-hatched line shows an increase of 20 knots to 120
knots. The double-hatched line to the right of the maximum speed indicates
a decrease of 20 knots to 120 knots. Wind directions are indicated by the
orientation of arrow shafts in relation to true north.
![]() Volcanic Activity - Volcanic activity
is indicated by a trapezoidal figure as depicted to the left. The symbol
designates the location of volcanic activity on the High Level Significant
Weather Charts. The "." at the base of the symbol will be located at the
latitude/longitude of the volcano. The symbol and any known information
concerning the name of the volcano, latitude and longitude, the date and
time of the first eruption, and a reminder to check any SIGMETs for further
information will be included in the legend of the chart. An example of
the information which is to be included in the chart's legend is provided
in Table 8-3.
Volcanic Activity - Volcanic activity
is indicated by a trapezoidal figure as depicted to the left. The symbol
designates the location of volcanic activity on the High Level Significant
Weather Charts. The "." at the base of the symbol will be located at the
latitude/longitude of the volcano. The symbol and any known information
concerning the name of the volcano, latitude and longitude, the date and
time of the first eruption, and a reminder to check any SIGMETs for further
information will be included in the legend of the chart. An example of
the information which is to be included in the chart's legend is provided
in Table 8-3.
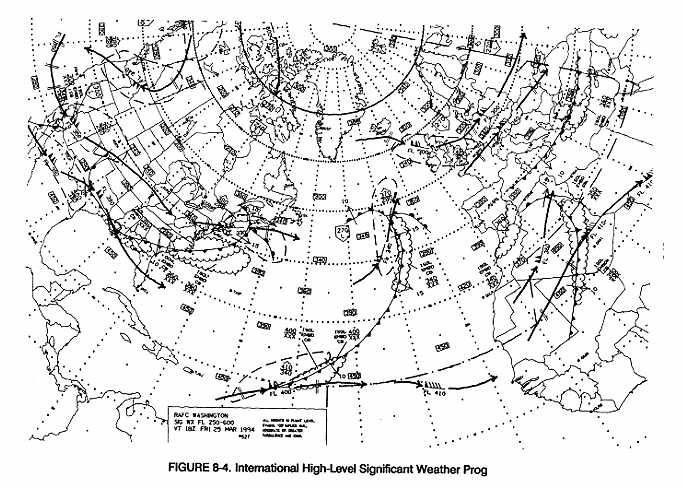
INTERNATIONAL FLIGHTS
Figure 8-4 is an example of the High Level Significant Weather prog chart for international flights between the U.S. and Europe and northern Africa. It basically has the same information and notation as the domestic High Level Significant Weather prog. It is for flights between 25,000 feet and 60,000 feet pressure altitude and is on a polar map projection. Referring to Figure 8-4, the legend shows NMC as a Regional Area Forecast Center (RAFC) and the originator of this significant weather prog. The valid time of this particular prog is 18Z on March 25, 1994.