WINDS AND TEMPERATURES ALOFT CHARTS
Winds aloft, both forecast and observed, are a computer-generated product. The forecast winds aloft charts also contain forecast temperatures aloft.
FORECAST WINDS AND TEMPERATURES ALOFT (FD)
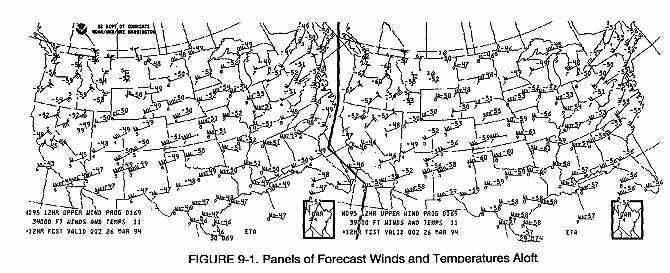
Forecast winds and temperatures aloft are prepared for eight levels on eight separate panels. The levels are 6,000; 9,000; 12,000; 18,000; 24,000; 30,000; 34,000 and 39,000 feet MSL. They are available daily as 12 hour progs valid at 1200Z and 0000Z. A legend on each panel shows the valid time and the level of the panel. Levels below 18,000 feet are in true altitude and levels 18,000 feet and above are in pressure altitude. Figure 9-1 is examples from a winds and temperatures aloft forecast chart.
Temperature is in whole degrees Celsius for each forecast point and is entered above and to the right of the station circle. Arrows with pennants and barbs, similar to those used on the surface map, show wind direction and speed. Wind direction is drawn to the nearest 10 degrees with the second digit of the coded direction entered at the outer end of the arrow. To determine wind direction, obtain the general direction from the arrow and then use the digit to determine the direction to the nearest 10 degrees. For example, a wind in the northwest quadrant with a digit of "3," indicates 330 degrees. A calm or light and variable wind is shown by "99" entered to the lower left of the station circle. See Table 9-1 for examples of plotted temperatures and winds with their interpretations.
OBSERVED WINDS ALOFT
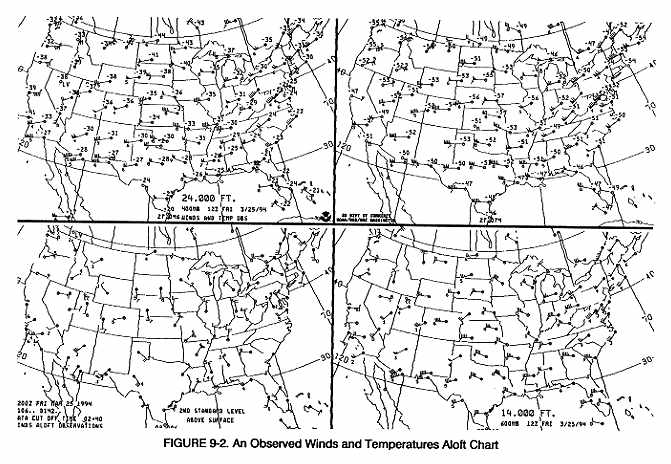
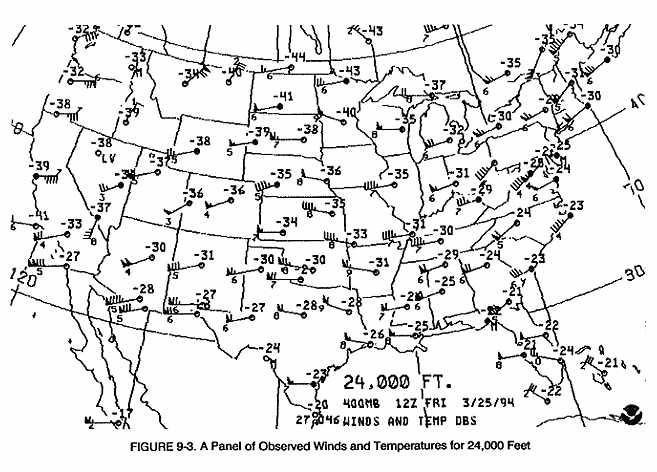
Charts of observed winds for selected levels are sent twice daily on a four-panel chart valid at 1200Z and 0000Z. Figure 9-2 is an example of this chart and Figure 9-3 is an example of one of the panels. Wind direction and speed is shown by arrows, the same as on the forecast charts. A calm or light and variable wind is shown as "LV" and a missing wind as "M," both plotted to the lower right of the station circle. The station circle is filled in when the reported temperature/dew point spread is 5 degrees Celsius or less. Observed temperatures are included on the upper two panels of this chart (24,000 feet and 34,000 feet). A dotted bracket around the temperature means a calculated temperature.
TABLE 9-1. Plotted winds and temperatures.
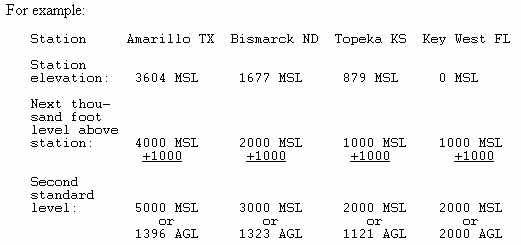
The second standard level for a reporting station is found between 1,000
and 2,000 feet above the surface, depending on the station elevation. To
compute the second standard level, find the next thousand feet level above
the station elevation and add 1,000 feet to that level. For example, the
next thousand foot level above Oklahoma City, OK (station elevation 1,290
feet MSL) is 2,000 feet MSL. The second standard level for Oklahoma City,
OK (2,000 feet + 1,000 feet) is 3,000 feet MSL or 1,710 feet AGL.
|
Note that the 14,000 feet MSL panel is true altitude while the 24,000 and 34,000 feet MSL panels are in pressure altitude.
USING THE CHARTS
The use of the winds aloft chart is to determine winds at a proposed flight altitude or to select the best altitude for a proposed flight. Temperatures also can be determined from the forecast charts. Interpolation must be used to determine winds and temperatures at a level between charts and data when the time period is other than the valid time of the chart.
Forecast winds are generally preferable to observed winds since they are more relevant to flight time. Although observed winds are 5 to 8 hours old when received, they still can be a useful reference to check for gross errors on the 12-hour prog.
INTERNATIONAL FLIGHTS
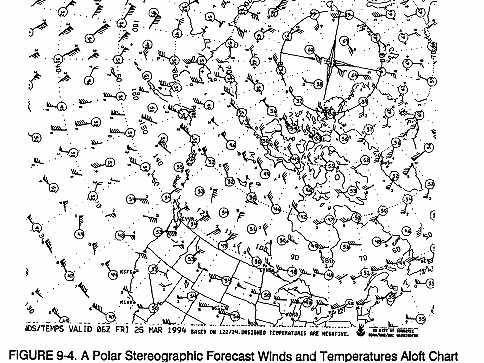
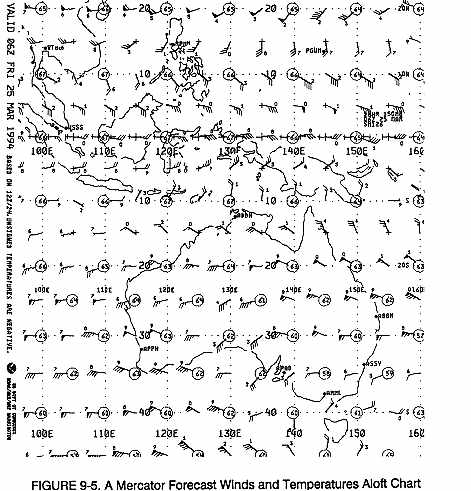
Computer-generated forecast charts of winds and temperatures aloft are available for international flights at specified levels. The U.S. National Meteorological Center (NMC), near Washington D.C., is a component of the World Area Forecast System (WAFS). NMC is designated in the WAFS as both a World Area Forecast Center and a Regional Area Forecast Center (RAFC). Its main function as a World Area Forecast Center is to prepare global forecasts in grid-point form of upper winds and upper air temperatures and to supply the forecasts to associated RAFCs. One of NMC's main RAFC functions is to prepare and supply to users charts of forecast winds, temperatures, and significant weather.
For example, Figures 9-4 and 9-5, are originated by NMC. The flight level of Figure 9-4 is 34,000 feet MSL and Figure 9-5 is 45,000 feet MSL. This along with the valid time of the chart, and the data base time (data from which the forecast was derived) make up the legend along an edge of each chart.
Forecast winds are expressed in knots for spot locations with direction and speed depicted in the same manner as the U.S. forecast winds and temperatures aloft chart (Figure 9-1). Forecast temperatures are depicted for spot locations inside circles which are expressed in degrees Celsius. For charts with flight levels at or below FL180 (18,000 feet), temperatures are depicted as negative (-) or positive (+). On charts for flight levels (FL) above FL180, temperatures are always negative and no sign is depicted.