
![]()
|
|
||
CHAPTER 2. Aerodynamics Forces in Flight The four forces that affect WSC fl ight are thrust, drag, lift, and weight. [Figure 2-12] In level, steady WSC fl ight: 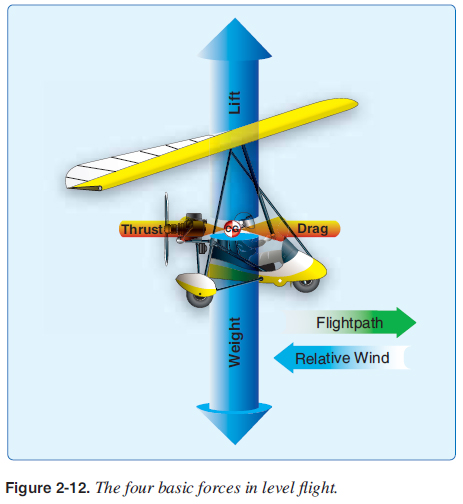
Note that the lift and weight forces are much greater than the thrust and drag forces. A typical example for many WSC aircraft is that the lift/weight forces are fi ve times the thrust/drag forces. Thrust—the forward force produced by a powerplant/propeller as it forces a mass of air to the rear (usually acts parallel to the longitudinal axis, relative wind, and fl ightpath). Drag—the aerodynamic force acting on the wing and carriage in the same plane and in the same direction as the relative wind. Lift—the aerodynamic force caused by air fl owing over the wing that is perpendicular to the relative wind. Weight—the force of gravity acting upon a body straight down and perpendicular to the Earth. During level fl ight, these forces are all horizontal and vertical. During descents or climbing, these forces must be broken down into components for analysis. Dynamic Pressure (q) Both lift and drag are a direct result of the dynamic pressure of the air. Dynamic pressure (q) is created from the velocity of the air and the air density. An increase in velocity has a dramatic effect on dynamic pressure (q) because it increases with the square of the velocity. Doubling the velocity means “q” increases by four times. Increasing the velocity by a factor of three means that the dynamic pressure (q) increases by a factor of nine. This is a very important concept in understanding the aerodynamics of WSC. Formula for dynamic pressure: q = V2 x ?/2 V = velocity ? = density factor Lift Lift opposes the downward force of weight and is produced by the dynamic effects of the surrounding airstream acting on the wing. Lift acts perpendicular to the fl ightpath through the wing’s center of lift. There is a mathematical relationship for lift which varies with dynamic pressure (q), AOA, and the size of the wing. In the lift equation, these factors correspond to the terms q, coeffi cient of lift (CL), and wing surface area. The relationship is expressed in Figure 2-13. 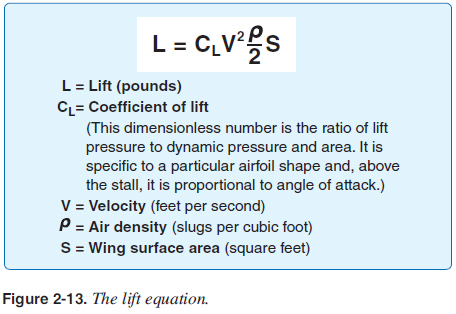 Figure 2-13 shows that for lift to increase, one or more of the factors on the other side of the equation must increase. Generally, the lift needed is about the same for most fl ight situations. A slower speed requires a higher AOA to produce the same amount of lift. A faster speed requires a lower AOA to produce the same amount of lift. Because lift is a function of dynamic pressure (q), it is proportional to the square of the airspeed; therefore, small changes in airspeed create larger changes in lift. Likewise, if other factors remain the same while the CL increases, lift also increases. The CL goes up as the AOA is increased. As air density increases, lift increases. However, a pilot is usually more concerned with how lift is diminished by reductions in air density on a hot day, or if operating at higher altitudes. All wings produce lift in two ways:
Both principles determine the lifting force. Review the Pilot’s Handbook of Aeronautical Knowledge to understand Newton’s laws of motion and Bernoulli’s venturi effect. Figure 2-14 (top) shows the amount of lift produced along the wing for an airplane wing with an elliptical planform. Notice how the amount of lift generated is smallest at the tips and increases slightly towards the root of the wing. This is known as the “elliptical lift distribution.” 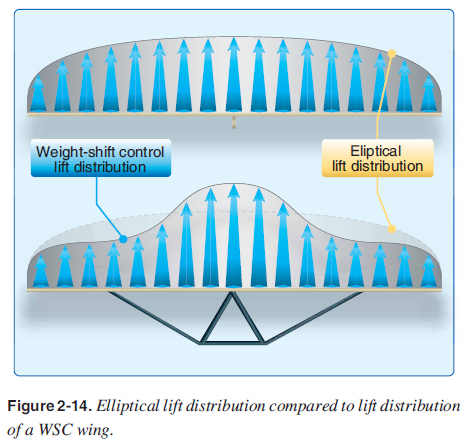 The WSC wing lift distribution is different because the wing twist at the root is at a higher AOA than the tips. Most of the lift is produced at the center of the wing with less lift produced at the tips. The WSC lift distribution is compared to the lift distribution for an optimum design elliptical wing in Figure 2-14. |
| ©AvStop Online Magazine Contact Us Return To Books |
