 |
|
|
|
|
|
|||
|
By Jim Douglas |
||||
 |
April 9, 2010 -
The National Transportation Safety Board today released preliminary
aviation accident statistics for 2009 showing an overall decrease in
In fact, on-demand
Part 135 operations had the lowest number of accidents and fatal
accidents for that type of air operation in the last 2 decades.
The total number
of |
|||
|
General aviation
accidents decreased from 1,566 in 2008 to 1,474 in 2009. There were 272
fatal general aviation accidents, down from 275 the year before.
However, the accident rate increased to 7.20 per 100,000 flight hours in
2009 from 6.86 in 2008, due to the decrease in the number total of
flight hours. Although
fatalities decreased from 494 to 474, the fatal accident rate increased
to from 1.21 to 1.33.
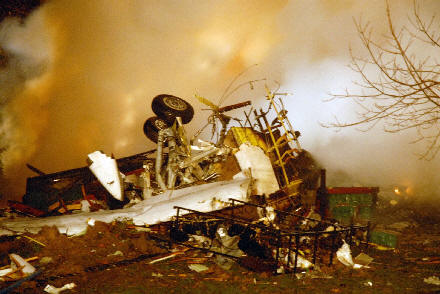
Last year, one
fatal accident occurred involving a scheduled Part 121 operator.
On February 12, 2009, a Colgan Air, Inc., Bombardier DHC-8- 400,
operating as Continental Connection flight 3407, crashed outside of
Buffalo , New York, resulting in 50 fatalities.
On-demand Part 135
operations reported 47 accidents in 2009, a decrease from 58 in 2008.
Fatalities also decreased from 69 in 2008 to 17 in 2009.
The accident rate decreased to 1.63 per 100,000 flight hours in
2009 from 1.81 in 2008. |
||||
|
||||||||||||||||||||||||||||||||||||||||||||||||||||||||||||||||||||||||||||||||||||||||||||||||||||||||||||||||||||||||||||||||||||||||||||||||||||||||||||||||||||||||||||||||||||||||||||||||||||||||||||||||||||||||||||||||||||||||||||||||||||||||||||||||||||||||||||||||||||||||||||||||||||||||||||||||||||||||||||||||||
| ?AvStop
Online Magazine
Contact
Us
Return To News
|
||||||||||||||||||||||||||||||||||||||||||||||||||||||||||||||||||||||||||||||||||||||||||||||||||||||||||||||||||||||||||||||||||||||||||||||||||||||||||||||||||||||||||||||||||||||||||||||||||||||||||||||||||||||||||||||||||||||||||||||||||||||||||||||||||||||||||||||||||||||||||||||||||||||||||||||||||||||||||||||||||
