| NEWSROOM |
|
|
![]()
![]()
|
|
|
|
|
|
|
|||
|
By Daniel Guevarra |
||||
 |
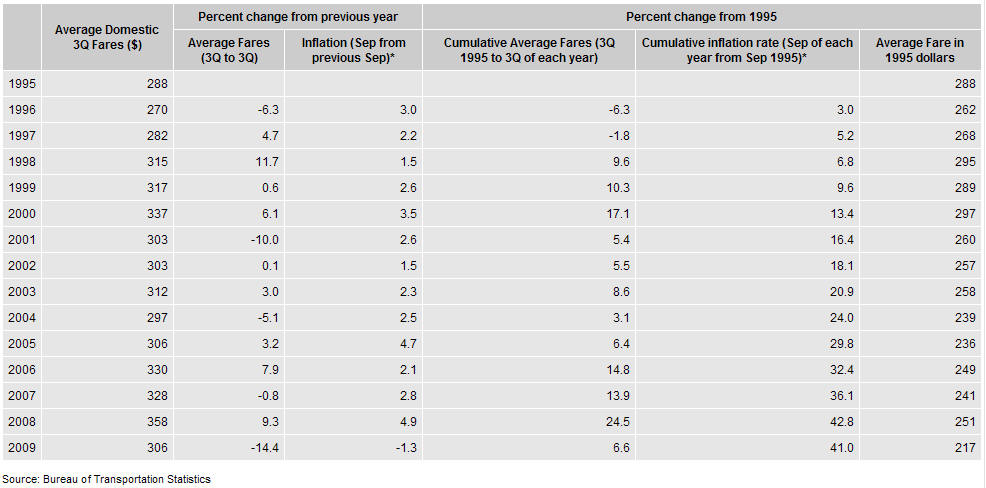
January 29, 2010 - Average domestic air fares in the third quarter of 2009 fell to their lowest July-to-September level since 2005, dropping 14.4 percent from the third quarter of 2008 in the largest year-to-year decline on record, the U.S. Department of Transportation's Bureau of Transportation Statistics (BTS) reported yesterday. BTS, a part of the Research and Innovative Technology Administration, reports average fares based on domestic itinerary fares, round-trip or one-way for which no return is purchased.
Fares are based on
the total ticket value which consists of the price charged by the
airlines plus any additional taxes and fees levied by an outside entity
at the time of purchase. Fares include only the price paid at the time
of the ticket purchase and do not include other fees, such as baggage
fees, paid at the airport or onboard the aircraft. Averages do not
include frequent-flyer or “zero fares” or a few abnormally high reported
fares. |
|||
|
The third quarter 2009 average fares were up 3.3 percent from the
post-9/11 third-quarter $297 in 2004. BTS air fare records reach back to
1995. Third quarter average fares were up 1.7 percent from the second
quarter of 2009.
Quarter-to-quarter changes may be affected by seasonal factors.
Average fares in this release may not be comparable to BTS fare press
releases before the second quarter of 2007 which did not exclude
frequent flyer fares or abnormally high fares.
Bulk fares continue to be excluded as in earlier releases.
Beginning with the first quarter 2008 release, BTS does not include
There was only one year-to-year average fare increase for the third
quarter among the 100 largest airports ranked by originating passengers
at 2.5 percent, in |
||||
|
3rd Quarter
Average Fares 1995-2009 Compared to Inflation Rate
Fares based on
domestic itinerary fares, round-trip or one-way for which no return is
purchased. Fares are based on the total ticket value which consists of
the price charged by the airlines plus any additional taxes and fees
levied by an outside entity at the time of purchase. Fares include only
the price paid at the time of the ticket purchase and do not include
other fees, such as baggage fees, paid at the airport or onboard the
aircraft. Averages do not include frequent-flyer or “zero fares” or a
few abnormally high reported fares.
|
||
| ©AvStop
Online Magazine
Contact
Us
Return To News
|
||
|