How do aviation emissions compare to general trends in local air pollutants?


  NEWSROOM  


How Do Aviation Emissions Compare To General Trends In Local Air Pollutants?


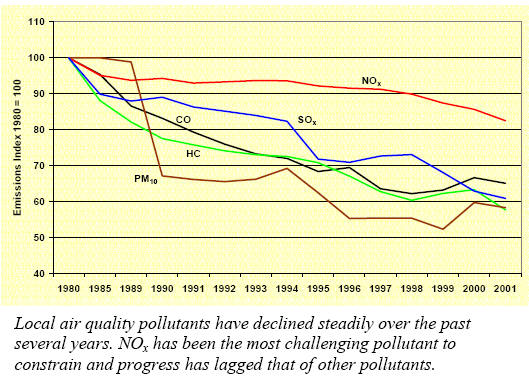
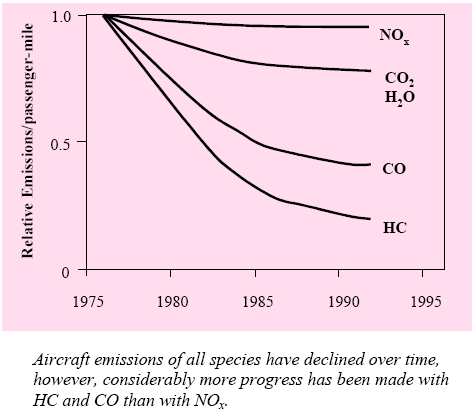
Compared to other sources, aviation emissions are a relatively small contributor to air quality concerns both with regard to local air quality and greenhouse gas emissions. While small, however, aviation emissions cannot be ignored. 

In the past three decades, aggregate emissions of the air pollutants EPA regulates (nitrogen dioxide, ozone, sulfur dioxide, particulate matter, carbon monoxide, and lead) have declined by 25 percent nationally, according to their report National Air Quality 2001 Status and Trends10.  

As can be seen in the following chart, greater progress has been made with some individual pollutants than with others. Aircraft emissions have also declined over time when you consider the emissions from transporting one passenger one mile. The following chart shows that relative aircraft emissions have fallen consistently over time.


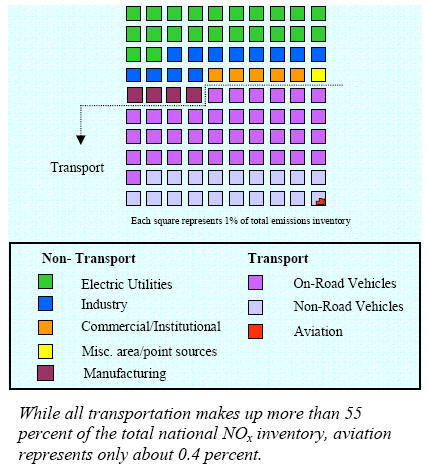
Total aircraft emissions have increased, however, since aviation has grown considerably over the same period. As with emissions nationally, a great deal of progress has been made reducing emissions of HC and CO. 

NOx, a key constituent of ozone, has proven to be the most difficult pollutant to control both nationally and for aviation. NOx comes from a wide variety of sources in all sectors of the economy. Since essentially all NOx comes from combustion processes, electric utilities, industry, and transportation are significant emitters and make up the largest share of the total inventory. Currently aviation contributes 0.4 percent of the inventory as can be seen in the illustration. 

Aviation’s contribution to the national NOx emissions inventory has recently declined further as air travel growth has been interrupted during the past two to three years due to the terrorist acts of 9/11, the war on terrorism in Iraq, the emergence of severe acute respiratory syndrome (SARS), and a generally difficult economic environment. These conditions have caused a more than ten- percent decline in air traffic and a similar drop in emissions.  


However, these factors are not likely to have a permanent effect on air transportation and growth of travel demand and emissions have recently resumed. Total national pollutant inventory numbers do not tell the full story with regard to aviation’s contribution in regions with air quality problems.  

The worst local air quality generally occurs in and around cities, which is also where aviation activity primarily occurs. The Clean Air Act requires EPA to identify air quality areas and to determine whether they comply with (i.e. attain) National Ambient Air Quality Standards13. 

Ozone is by far the principal air quality problem in U.S. cities today. According to EPA data14, there are currently 474 counties, out of 3,142 counties nationally, that do not meet the new 8- hour ozone standard and are considered non attainment areas. Comparing this list to the location of primary U.S. airports, 37 of the 50 largest airports are in ozone non attainment areas.  

To calculate aviation’s contribution to regional NOx, we can examine local emission inventories.  A multitude of sources comprises air quality area emission inventories.


• Point sources – large stationary, industrial facilities that are regulated under Federal, state, or local regulations,

• On-Road Mobile sources – cars, trucks, buses, and other vehicles licensed for highway travel,

• Non-Road Mobile sources – aircraft, ground support equipment, construction equipment, farm equipment, boats, locomotives, and lawn and garden equipment, and

• Area sources – small sources that individually have low emissions but that are significant when combined throughout the area like dry cleaning establishments, bakeries, painting, and vehicle fueling. 

The table on the following page summarizes aviation’s contribution to NOx emission inventories in several metropolitan areas. All of these areas have at least one airport that is among the 50 largest airports in the country. To provide a context, Atlanta, Chicago O’Hare, and Los Angeles International are the three busiest U.S. airports.  

In 2002, Atlanta had nearly 900,000 aircraft operations and enplaned over 37 million passengers; Chicago O’Hare had over 900,000 aircraft operations and enplaned almost 32 million passengers; and Los Angeles International had nearly 800,000 aircraft operations and enplaned almost 27 million passengers.

In the Southern California area, categorized as “severe” non attainment, EPA’s most restrictive designation, aviation’s contribution was less than two percent even where the cumulative NOx from multiple airports was included.  

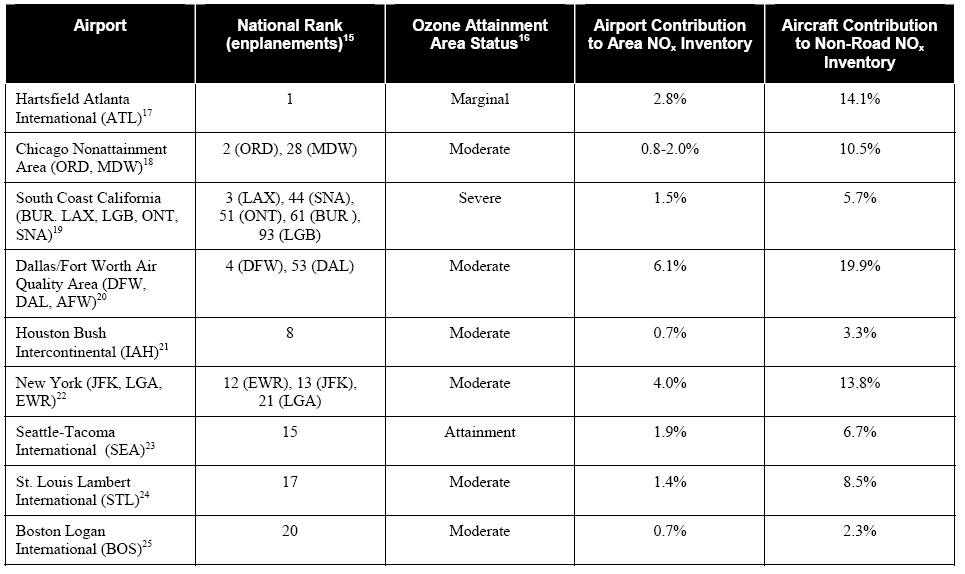
While it is apparent from this data that aviation emissions make only a small contribution to regional emissions, even at the largest airports and even in areas with the worst air quality, it is still a contribution that needs to be dealt with effectively.


 ©AvStop Online Magazine                                                                                                                                                                                        Contact Us              Return To News

AvStop Aviation News and Resource Online Magazine

Grab this Headline Animator