How do aviation’s greenhouse gas emissions compare to other transportation sources?


How Do Aviation’s Greenhouse Gas Emissions Compare To Other Transportation Sources?


Energy intensity, that is the amount of energy consumed to transport one passenger one mile, is a useful metric for comparing greenhouse gas emissions among different transportation modes. The different modes use similar fuels and greenhouse gas emissions are directly related to fuel use.

As you can see in the following chart, in the U.S., aircraft and automobiles have very similar energy intensities, with automobiles at 3,543 Btu/passenger mile versus airlines at 3,666 Btu/passenger mile.

Rail has the lowest energy use, and hence emissions, per passenger mile among all transport modes. Personal trucks and transit buses have the highest energy intensities. 

Comparing the energy intensity of aircraft and cars shows how energy efficiency and consequently greenhouse gas emissions per passenger mile have changed over the past 35 years. The chart shows how significant this has been, especially for aircraft. 


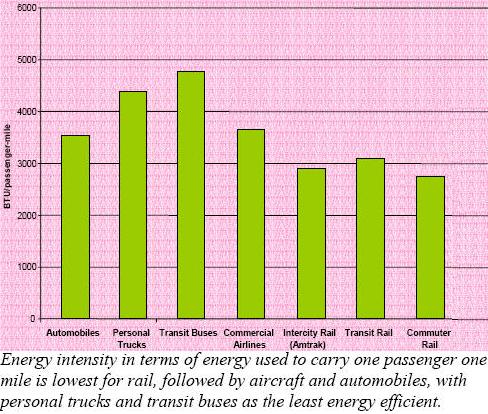
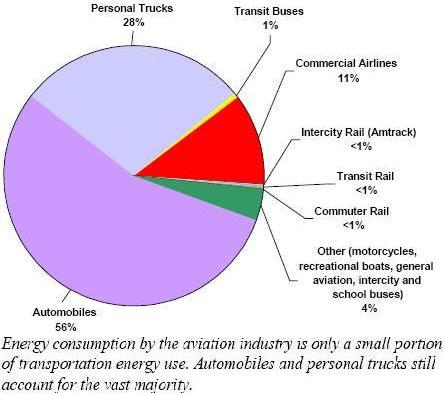
The pie chart shows the total energy consumption for each transportation mode. Since the fuels are similar, this is an indication of their total greenhouse gas emissions. Aviation is substantially less than automobiles and personal trucks though significantly more than rail and buses. However, given the greater potential to apply alternative fuel technologies to land-based transport in the next two decades, aviation greenhouse gas emissions are likely to represent a greater share of transport sources over time.


 ©AvStop Online Magazine                                                                                                                                                                                    Contact Us              Return To News

AvStop Aviation News and Resource Online Magazine

Grab this Headline Animator